Every plant already pays for energy loss. It shows up as waste heat from hot surfaces, compressed-air leaks you can hear, friction in worn drives, and machines that sit idle while still drawing power.
That’s the core of industrial energy efficiency: getting the same (or better) output with less energy. When it’s done well, you’ll usually see two results that operators and finance both care about: lower utility bills and steadier production with fewer nuisance trips.
The timing matters. U.S. manufacturing energy use rose about 6% from 2018 to 2022, based on the latest complete federal survey data. At the same time, a bit over 40% of establishments report taking part in general energy management activities, which implies many sites still have basic wins available.
This guide shows where energy is typically lost, which upgrades often pay back without major downtime, and how to stop savings from fading after the project closes.
 Photo by CHINA YU
Where factories waste energy most, and how to spot it fast
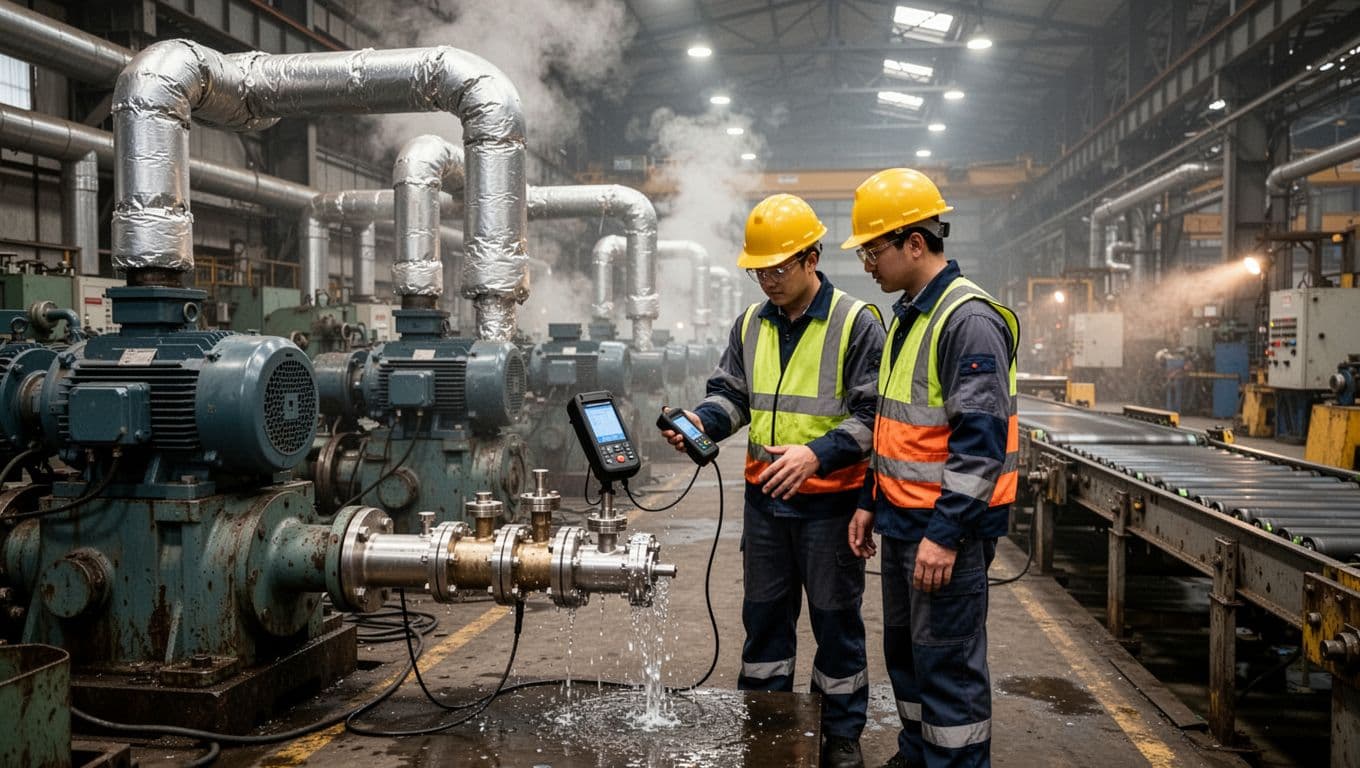
Two maintenance techs check a compressed-air leak while nearby equipment keeps running.
Energy waste hides in plain sight because it often looks like “normal operation.” A blower that runs 24/7 feels harmless until you see the amp draw. A steam header without insulation seems fine until an IR scan shows surface temps cooking the room. Even a well-run plant can carry years of small changes, a bypass valve left cracked open, a pressure setpoint bumped up for one problem shift, or a conveyor left in “ready” mode all weekend.
Start by thinking in systems, not machines. Most plants spend energy in a few buckets: motors, compressed air, steam and hot water, process heating and cooling, and building loads. Those systems cross departments, so their losses don’t always land on one person’s KPI.
If you run in chemicals, metals, paper, or petroleum, the payoffs tend to be larger because energy is a bigger part of unit cost. For broader context on where industrial energy is used and common improvement areas, the Manufacturing and Industrial Efficiency Toolkit is a solid starting point.
The usual suspects: motors, compressed air, steam, heat, and idle loads
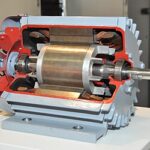
Motors and driven loads (pumps, fans, conveyors) often dominate electrical use. Warning signs include oversized motors running cool, throttled discharge valves, and dampers used to “control” airflow while the fan stays at full speed.
Compressed air is another frequent culprit. Listen for hissing, watch for pressure creep across shifts, and note tools that blow air continuously even when no part is present.
Steam and hot-water systems waste energy through failed traps, poor condensate return, high blowdown, and bare valves and flanges. A cold condensate line where it should be warm can be a clue, but so can the opposite, a hot return line that’s flashing steam.
Process heat losses show up as hot exhaust to atmosphere, overheated make-up air, or cooling systems fighting heat you didn’t need to add. Finally, idle loads add up: ovens in “standby” at production temperature, air compressors running to feed one regulator, and HVAC conditioning spaces with open dock doors.
Quick checks before you buy anything: walkthroughs, logs, and baselines
A fast audit doesn’t need a big consulting study. First, do a focused floor walk with operators and maintenance. Ask what they routinely “work around.” Next, pull run hours from drives, MCC buckets, or SCADA trends, then compare those hours to production schedules.
Utility bills help too. Build a baseline that relates energy to output, for example kWh per unit, therms per batch, or scfm per shift. Once you have that ratio, you can spot drift even when production changes.
Temporary tools can speed this up:
- Ultrasonic leak detection for compressed air and vacuum leaks
- IR imaging for insulation gaps, overheated electrical joints, and steam issues
- Portable power loggers for motors, heaters, and demand spikes
- Pressure and temperature trending from existing transmitters, if they’re calibrated
Safety stays non-negotiable. Follow lockout rules, verify zero energy, and treat steam and rotating equipment as high-risk, even during “quick checks.”
High-impact upgrades that usually pay back, without stopping production
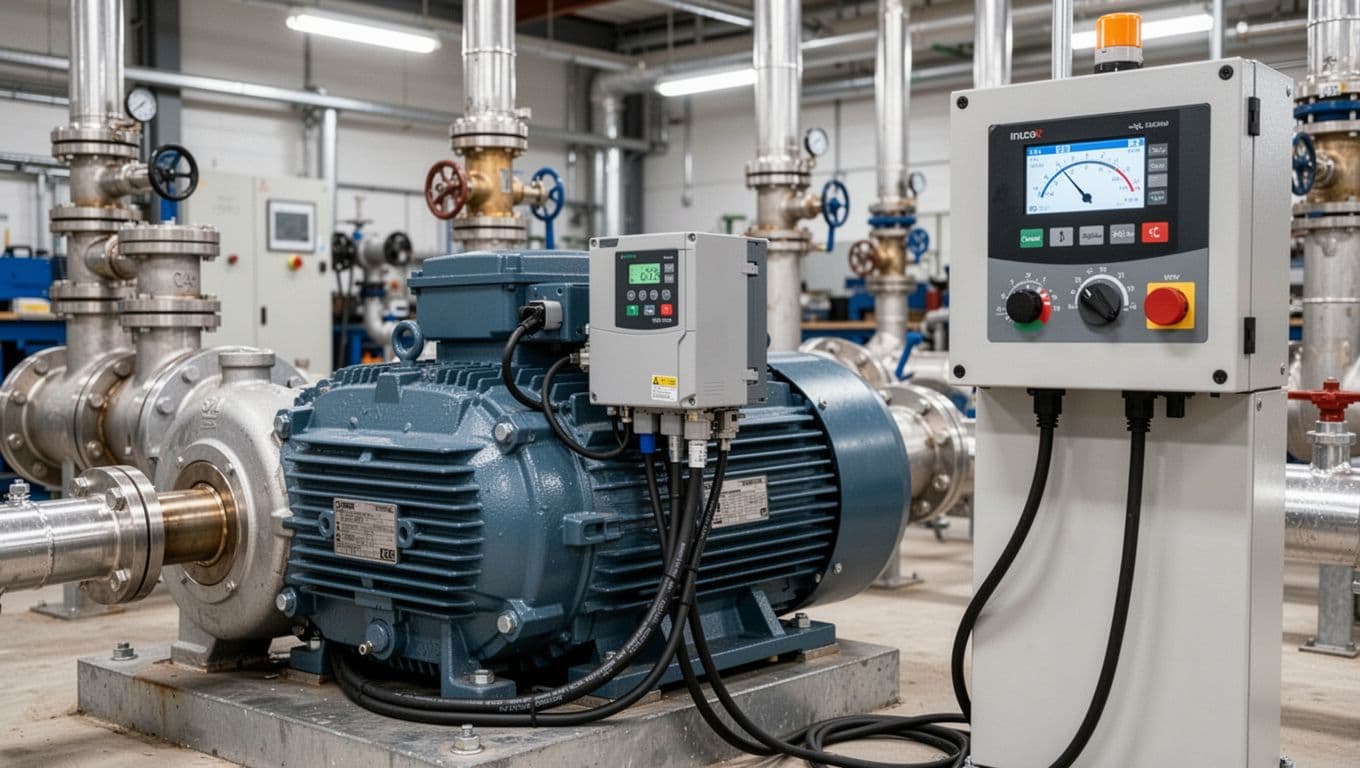
A VFD controls a pump motor speed to match demand.
The best projects share three traits. They target big loads, they reduce waste without adding operator burden, and they don’t require a long shutdown. Still, plan around production reality. A “simple” swap can stall if you need new starters, arc-flash labeling updates, or control logic changes.
When in doubt, start small and prove the savings on one line. After that, replication becomes your strongest business case.
Motors and drives: match speed to the job instead of wasting torque
Fans and pumps often run far from their design point. If you control flow with a valve or damper, you burn energy across a restriction. Speed control usually costs less to operate because the load drops quickly as speed drops (affinity laws for centrifugal loads).
A plain example: a pump that runs full speed while a valve “slows” the flow wastes power as heat and pressure drop. In contrast, a VFD reduces motor speed, so the pump produces only the head and flow you need.
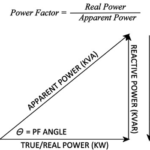
Also check motor sizing. Oversized motors can run at low load with poor efficiency and low power factor. Meanwhile, worn couplings, misalignment, and belt slip turn kWh into vibration and heat. In many plants, fixing alignment and control strategy saves as much as new hardware.
If you’re tying energy work to automation upgrades, it helps to align controls, instrumentation, and operator displays. Articles like PLC and SCADA optimization for energy-efficient automation can help you think through the control-side impacts before you touch the MCC.
Compressed air: treat leaks and pressure creep like a hidden tax
Compressed air is convenient, but it’s expensive to produce. You pay for motor power, heat of compression, pressure drops across dryers and filters, and then leaks push a chunk of that air into the room.
Start with leaks because they’re simple to verify. A small leak doesn’t look like much, yet across a year it can add up fast when you have dozens of them. Next, address pressure creep. Plants often run higher pressure than needed because one end use complains. The fix might be a local regulator, larger drop, or re-piping, rather than raising the whole system.
Other common wins include better dryer control, filter maintenance to cut pressure drop, and automatic shutoff valves that isolate idle areas. In some cases, replacing air-driven devices with electric actuators can reduce both energy and maintenance, especially when the air quality is poor.
For practical guidance on matching pressure to end uses and improving system performance, see the Compressed Air Challenge efficiency tip sheet.
Steam and process heat: recover heat, tune boilers, and insulate the basics
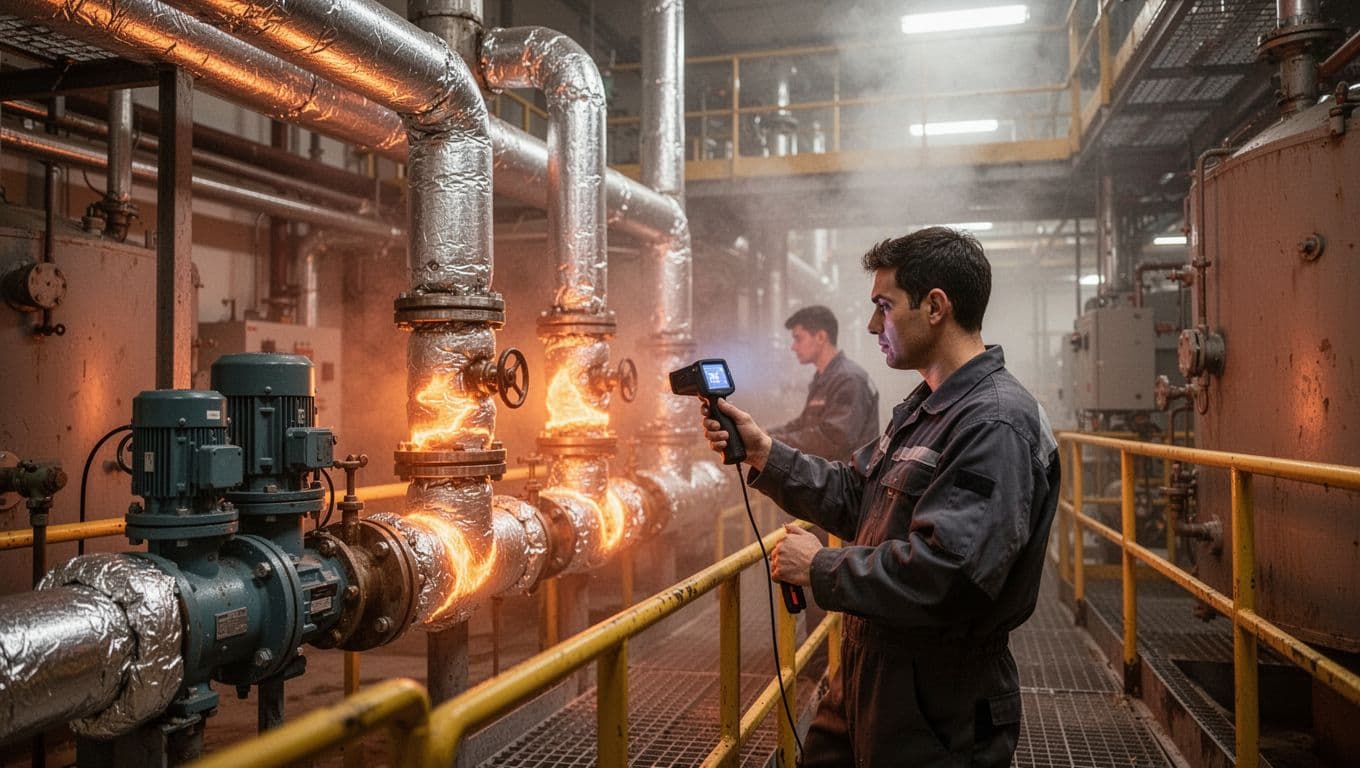
A tech checks steam-trap performance to reduce heat loss and improve reliability.
Steam systems can look fine while wasting a lot of energy. Failed-open steam traps dump live steam into the return. Failed-closed traps flood heat exchangers and reduce heat transfer, so operators compensate by raising setpoints.
Start with basics that also improve reliability:
- Tune boilers and verify oxygen control (or oxygen trim if installed)
- Return condensate when quality allows, since it carries heat and treated water
- Test traps on a schedule, then repair or replace promptly
- Insulate straight runs, valves, and flanges where surface temps are high
- Recover blowdown heat where it pencils out
Waste heat recovery sounds complex, but the idea is simple. Use hot exhaust or hot discharge streams to preheat incoming water or combustion air. That reduces fuel use without changing the process result.
The U.S. Department of Energy’s steam system overview lays out common loss points and improvement methods in plain engineering terms.
Make savings stick with data, controls, and simple habits
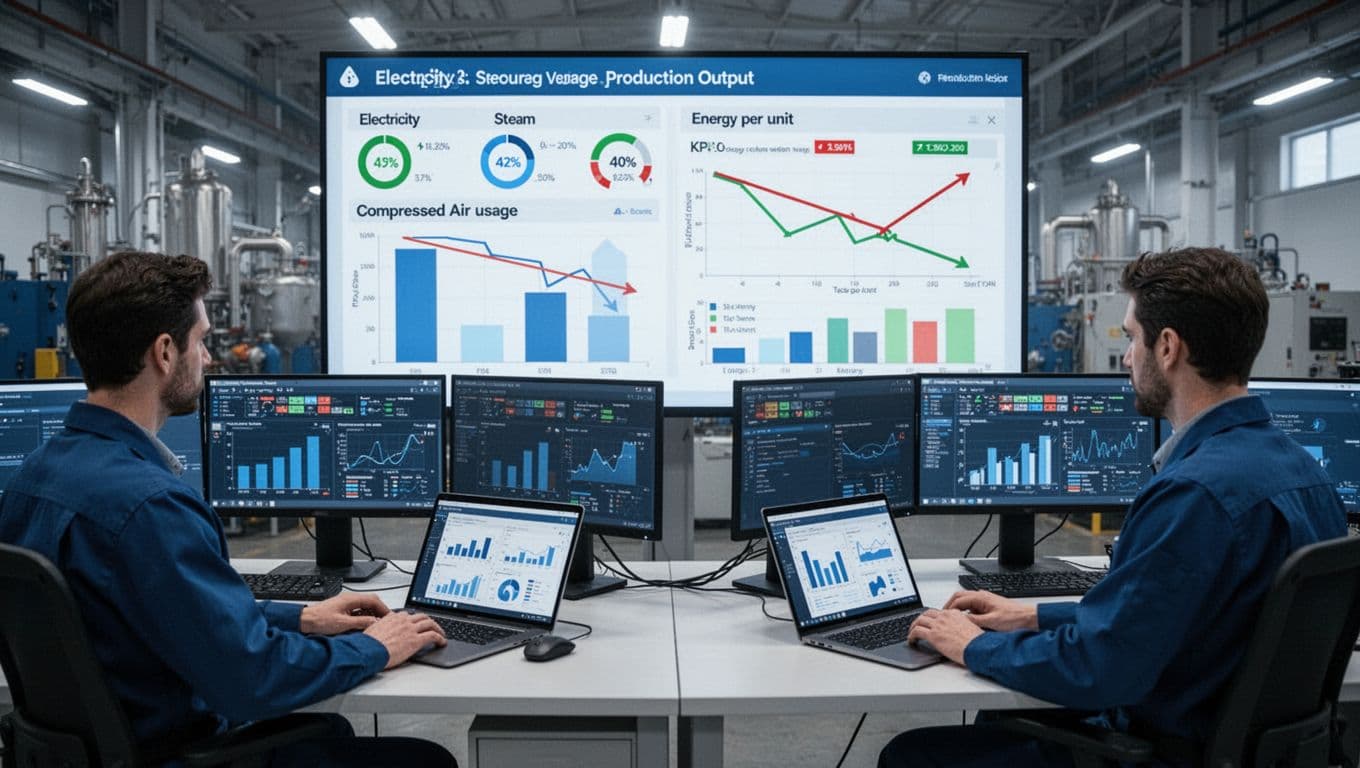
Operators monitor energy per unit alongside production, so drift is visible early.
Many plants win savings, then lose them slowly. Setpoints creep up, bypass valves get left open, and maintenance backlogs grow. The fix isn’t more reports. It’s a simple loop: measure, assign ownership, act, then verify.
If no one “owns” the response to an alarm, the dashboard becomes wall art.
From tracking to action: meters, KPIs, and alerts operators trust
Measure what you can influence. At a minimum, track electricity, gas, and production output. Next, add steam, compressed air, and key cooling loads if those are big costs on your site.
Keep KPIs tied to output. Energy per unit, energy per batch, and scfm per shift help you separate “busy month” from “waste month.” When possible, trend both rate (kW) and total (kWh). Rate catches demand spikes and control problems. Total helps validate savings.
IoT sensors, dashboards, and analytics can help find patterns, but only after you clean up tags and units. Avoid mixing estimated and metered values in the same KPI. Also set alert thresholds that match how the process runs, otherwise operators will mute them.
If you’re exploring connected monitoring and predictive approaches, EcoStruxure Foresight for factory energy optimization is a useful example of how asset health and energy signals can live in one view.
Controls that help, not annoy: scheduling, setpoints, and maintenance routines
Scheduling is an easy win when it’s designed with operators. Start and stop logic should match warm-up needs and quality constraints. For example, you might stage compressors, chillers, or dust collectors based on line status, not just time of day.
Setpoint control needs discipline. Lock critical setpoints behind change control, then log who changed what and why. Without that, yesterday’s workaround becomes tomorrow’s standard.
Maintenance keeps efficiency real. Dirty filters increase pressure drop. Misaligned belts waste power. Poor lubrication raises friction and heat. Compressed air leak checks should repeat quarterly because new leaks appear after every move, add, or change.
Finally, treat energy waste like any other defect. Reward teams for finding and fixing it, then share the fix across lines.
How to build a business case for industrial energy efficiency that finance will approve
Engineering logic doesn’t always win budget. Finance wants consistent assumptions, clear risk, and proof that savings will last. The good news is that energy projects often fit that model well when you include demand, maintenance, and downtime.
A helpful mindset is to compare projects like you’d compare spare parts. You wouldn’t pick the cheapest bearing if it causes trips. Energy measures work the same way.
What to calculate: energy savings, demand charges, maintenance, and downtime risk
Start with simple payback, but don’t stop there. Include demand charges when the project reduces peak kW. Add avoided maintenance, such as fewer compressor rebuilds after leak and pressure fixes. Also estimate the cost of unplanned downtime that the project reduces, like fewer boiler trips after trap maintenance.
Use the same time window and rate assumptions across options. If one project counts “best month” savings and another uses annual average, the comparison will mislead. After installation, verify savings with before-and-after data adjusted for production, weather, and product mix where needed.
For an overview of how industrial system improvements get framed and documented, the DOE’s BestPractices resource provides a practical reference.
Funding and incentives: common options that lower upfront cost
Upfront cost is often the real barrier. Utility rebates can reduce the price of VFDs, premium motors, compressed-air measures, and metering, although offerings vary by territory. Equipment financing can match payments to monthly savings when the measure is stable.
Some sites use performance contracts for larger bundles, where a provider ties compensation to measured results. Government incentives and standards also keep expanding as net-zero targets influence policy, but eligibility depends on location and project type. For a broad industry view of near-term actions companies are taking, see the industrial energy efficiency playbook.
The practical step is simple: check your utility’s program list, then align the paperwork with your project schedule early. Waiting until after installation often limits what you can claim.
Conclusion
Industrial energy efficiency works best when you treat it like reliability work. First, find where energy is lost, then start with high-return systems like motors, compressed air, steam, and process heat. After that, lock savings in with metering, clear KPIs, and routines that prevent drift.
Pick one action you can do this week: baseline kWh per unit on a single line, schedule a compressed-air leak hunt, test a set of steam traps, or review motor run hours against production. Small wins build trust, and those savings can fund the next round of upgrades. In the end, industrial energy efficiency is a cost move and a uptime move, and the plants that keep at it tend to run calmer.