If your greenhouse gas numbers are sloppy, it’s not just an internal problem anymore. Investors question them, customers push back, and regulators can demand fixes. Even suppliers may ask for your data before they renew a contract.
Greenhouse gas reporting is the work of measuring emissions and sharing results in a consistent way. That consistency matters because people will compare your year to last year, and your company to others. Most reporting programs use Scope 1, Scope 2, and Scope 3, which separate emissions you directly create from emissions tied to purchased energy and your broader value chain.
In 2026, the bar keeps rising at the state level. California and New York are setting expectations that go beyond a basic spreadsheet. This guide lays out a simple, step-by-step plan to get numbers you can stand behind, and keep improving them over time.
What greenhouse gas reporting covers, and why the three scopes matter
At its core, greenhouse gas reporting answers one question: “How much climate pollution is tied to how we operate and what we sell?” Companies do it for compliance, credibility, and planning. It also helps spot waste. Energy, fuel, and freight costs often hide inside emissions totals.
To make this real, imagine a mid-sized U.S. manufacturer that builds commercial refrigeration equipment. It runs a plant, buys a lot of electricity, ships heavy products, and relies on a long list of parts suppliers. Emissions show up in obvious places (natural gas for boilers) and less obvious ones (customer electricity use after the product is sold).
The three scopes keep you honest. They prevent a company from reporting only what looks small. They also help stakeholders understand what you control today versus what you influence over time.
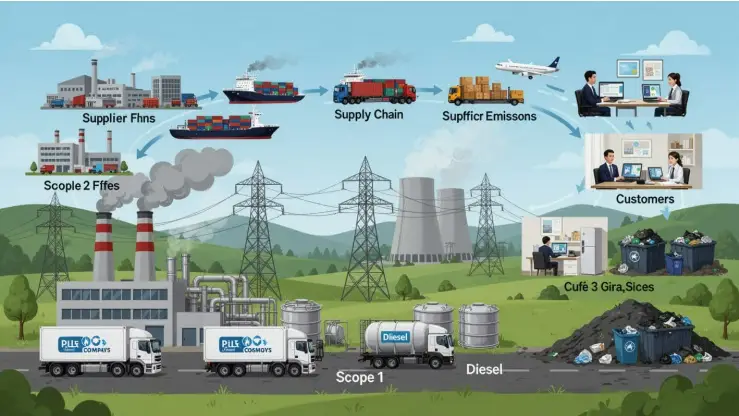
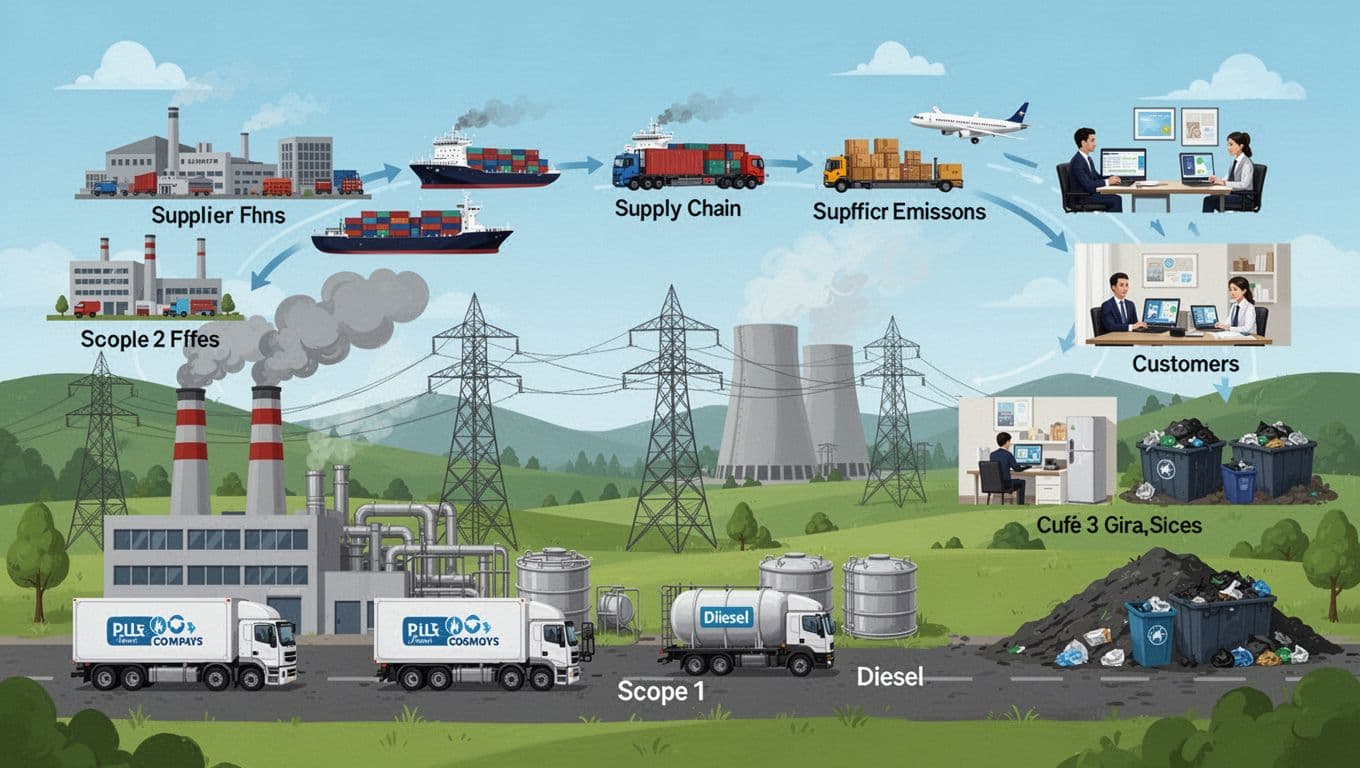 An at-a-glance view of Scope 1, 2, and 3 emission sources around a business, created with AI.
For a plain-language refresher that matches how many U.S. programs describe scopes, see the EPA’s Scope 1, 2, and 3 inventory guidance.
Scope 1, Scope 2, and Scope 3 explained with everyday examples
Scope 1 is direct emissions from sources you own or control. For our manufacturer, that includes natural gas burned in onsite boilers, diesel used by company trucks, and refrigerant leaks from test equipment.
Scope 2 is indirect emissions from purchased energy, mainly electricity (sometimes steam or chilled water). The plant doesn’t own the power plant, but its electricity demand causes generation somewhere.
Scope 3 covers other indirect emissions across the value chain. This is where the big numbers often live. Examples include emissions from producing purchased metals and electronics, third-party shipping, employee business travel, and the electricity customers use when running the refrigeration units. End-of-life disposal also counts.
Scope 3 is hardest because it reaches outside your walls. You’re using supplier data, estimates, and categories that don’t fit neatly into invoices. Still, ignoring it is like doing a budget while pretending rent doesn’t exist.
Common reporting boundaries that change your totals
Before you calculate anything, you have to decide what “your company” includes. Two choices drive big swings:
- Organizational boundary: Do you report based on ownership share (equity share), or based on control (financial or operational)?
- Operational boundary: Which emission sources do you count inside Scope 1 and 2, and which land in Scope 3?
The EPA summarizes common organizational boundary approaches in its organizational boundary guidance, which aligns with widely used accounting standards.
Here’s a quick set of questions that prevents surprises later:
- Which legal entities are in the inventory this year?
- Which sites operate under your brand but sit on leased property?
- Do you control any leased vehicles or equipment, and who fuels them?
- Do contractors run equipment on your site, and whose fuel is it?
- If you don’t own equipment, do you still control how it operates?
The fastest way to lose trust is to change boundaries without saying so. Pick an approach, apply it consistently, and document every exception.
Consistency year to year matters as much as the first-year method. Auditors and stakeholders can work with imperfect data, but they won’t accept mystery math.
The rules and standards shaping reporting in 2026 (what businesses should watch)
In the U.S., the reporting picture is uneven. Federal requirements may shift, while states tighten expectations. That split creates a common trap: teams assume federal pullbacks mean less work. Meanwhile, customers and states ask for more detail, more proof, and more frequent reporting.
One example is the U.S. EPA’s Greenhouse Gas Reporting Program (GHGRP). In September 2025, EPA proposed major changes that would end reporting for most categories if finalized, and it also proposed moving the deadline for 2025 data to June 10, 2026. Even if federal reporting shrinks, state programs and private reporting still need the underlying data.
The practical impact is simple: you may have fewer federal forms, but you still need a solid inventory to meet state rules, buyer requests, and assurance.
GHG Protocol is still the foundation, and it keeps evolving
Many corporate reporting programs map back to the GHG Protocol. That’s why updates there ripple across ESG reports, supplier portals, and assurance work.
In early 2026, GHG Protocol published its Land Sector and Removals Standard, which takes effect January 1, 2027. It provides methods to quantify land emissions, land-use change, and removals, and it also addresses some technological removals.
When should you care?
If you’re in agriculture, forestry, food, real estate, or packaging, land-related emissions can be material. The same goes for any company buying carbon credits or removals and wanting to explain them with confidence. Even manufacturers may run into this when customers ask how offsets were selected and accounted for.
California SB 253 is a major deadline for large companies
California’s SB 253 applies to companies with over $1 billion in annual revenue that are “doing business” in California. It calls for annual disclosure of Scope 1, Scope 2, and Scope 3 emissions, along with third-party assurance requirements that ramp over time.
Many implementation summaries point to August 10, 2026 as the initial due date for first disclosures (with early years focused on Scope 1 and 2 before Scope 3 phases in). For a current, plain-English summary, see SB 253 key requirements for 2026. Always confirm dates and phase-in rules against the latest California Air Resources Board updates, because timelines can shift during implementation.
The takeaway is operational, not theoretical: if you wait until summer 2026 to talk to suppliers, you’re late. Supplier data requests, contract language, and verification planning take time.
New York’s 2026 reporting program adds upstream emissions and monitoring plans
New York finalized a Mandatory GHG Reporting Program under 6 NYCRR Part 253, and it has a different feel than many corporate reports. It can require upstream emissions tied to fuels and electricity consumed in the state, even when those emissions occur outside New York.
Key milestones include monitoring plans due by December 31, 2026 for large sources, and first reports due June 1, 2027 for 2026 data (with verification and site visits for large sources). For the official program landing page, start with NYSDEC’s Mandatory Greenhouse Gas Reporting page.
For affected businesses, the punchline is simple: you may need fuel and power chain information you never tracked before. If procurement and operations don’t coordinate early, reporting becomes a scramble.
A simple, repeatable process for greenhouse gas reporting you can defend
A defensible process feels a lot like good accounting. You define boundaries, collect evidence, use consistent factors, and keep a clear audit trail. The teams that suffer most are the ones that treat reporting as a one-time spreadsheet project.
Build your inventory: pick a baseline year, map emission sources, and gather activity data
Start by choosing a baseline year. Pick a year with decent records and stable operations. You’ll compare future reductions to this baseline, so you want it to be credible.
Next, map emission sources by site and by scope. For our manufacturer, that means boilers, forklifts, fleet vehicles, purchased electricity, refrigerants, and major Scope 3 categories like parts suppliers and freight.
Most activity data is already in your systems. You just have to pull it together:
- Utility bills and interval meter data
- Fuel purchases and fleet card reports
- Refrigerant service logs
- Production volumes (helps with intensity metrics)
- Shipping records from carriers or 3PLs
- Travel and expense reports
- Supplier spend, bills of materials, and supplier footprints (when available)
If you manage buildings or plants, connected systems can help you tighten energy data over time. Building controls and metering integration often depend on interoperability standards, which is why teams sometimes reference BACnet for building automation when planning better energy monitoring.
Keep data quality simple: measured is best, calculated is fine, estimated is acceptable when documented. The goal is steady improvement, not perfection on day one.
Turn activity data into emissions with clear assumptions
Activity data becomes emissions using emission factors (for example, kg CO₂e per kWh, or per gallon of diesel). Consistency matters. If you change factors, document the reason and consider whether you need to restate prior years.
Electricity deserves extra care because it drives big swings. Many programs use two views:
A short table helps explain it to non-specialists.
| Scope 2 method | What it reflects | What can change it |
|---|---|---|
| Location-based | Average grid emissions where you operate | Grid mix, region, year |
| Market-based | Emissions tied to contracted electricity purchases | RECs, PPAs, supplier contracts |
Missing data happens. Don’t hide it. Use a conservative estimate, sampling, or secondary datasets for early Scope 3. Then track improvements like a backlog. Each year, replace the biggest estimates with better inputs.
Energy efficiency projects can lower both emissions and bills. Upgrading motors and drives, for example, can reduce electricity use in plants that run long hours. For a related look at high-efficiency equipment, see this overview of a liquid-cooled IE5 SynRM motor, since motor loads often dominate industrial electricity demand.
Set up controls, documentation, and version history before assurance starts
Assurance goes smoother when your process looks boring. Boring is good here.
Lightweight controls usually cover what verifiers want:
- Named owners for each data stream (utilities, fuels, refrigerants, travel)
- A monthly or quarterly review cadence
- A change log that notes what changed and why
- An evidence folder that ties each number to a document
- One “source of truth” file or system for final totals
Verifiers focus on completeness, accuracy, consistent methods, and traceable inputs. Run an internal pre-check before the verifier arrives. Fixing gaps early costs less than fixing them under deadline.
Make Scope 3 manageable without boiling the ocean
Scope 3 feels endless until you treat it like a prioritization problem.
Start with a screening pass. Identify which categories likely drive most emissions. For manufacturers, purchased goods and materials, freight, and use of sold products often dominate. For retailers, it’s often purchased goods, logistics, and customer use.
Then prioritize suppliers. A practical approach is to start with the highest spend, highest volume, or highest risk categories. Ask for supplier-specific data when possible, but accept that early years may rely on secondary data.
Supplier engagement works better when it’s simple:
- One short questionnaire with clear definitions
- Requests for product footprints where suppliers already have them
- A plan to add reporting expectations into contracts over time
Progress beats perfection. Each cycle, tighten one or two categories, and document improvements.
Mistakes that trigger greenwashing risk, and how to communicate results clearly
Bad reporting rarely comes from bad intent. It usually comes from weak boundaries, unclear Scope 2 choices, and overconfident claims. The fix is to communicate like an engineer, not like an ad.
Top errors: double counting, missing sites, bad Scope 2 choices, and weak Scope 3 data
Double counting happens when two teams report the same emissions. For example, logistics emissions might appear in both a facility inventory and a corporate freight estimate. Fix it by assigning each source to one owner and one category.
Missing sites is common after acquisitions or expansions. Add a formal “entity and site check” before each reporting cycle, and reconcile it to finance’s list.
Bad Scope 2 choices show up when teams mix market-based and location-based numbers without saying so. Report both when required, and label them clearly.
Weak Scope 3 data becomes a problem when a company presents rough estimates as precise facts. Spend-based models can be fine early on, but you must describe limits and your improvement plan.
How to publish a report people trust: be specific, show methods, and explain changes
A trustworthy report tells readers how you built the numbers. It doesn’t need to be long, but it must be clear. Include:
- Organizational and operational boundaries
- Scopes covered, plus what’s excluded and why
- Base year and any restatements
- High-level method notes and factor sources
- Material Scope 3 categories and data quality notes
- Explanations for big year-to-year swings (acquisitions, data upgrades, grid changes)
Don’t claim “carbon neutral” unless you can explain reductions first, then the role of offsets or removals, including how you accounted for them.
If you want to help readers understand electricity changes, a short context note can help. Grid emissions vary by region and by year, and generation sources differ widely. Even a general explainer, like this roundup of the world’s major power plants, can remind stakeholders why electricity isn’t a single, fixed number.
Conclusion
Greenhouse gas reporting in 2026 rewards teams that keep things consistent and documented. Start with the scopes, track state rules that apply to you (especially California and New York), then build an inventory with a clean audit trail. Over time, improve Scope 3 where it matters most, and explain limits in plain language.
This week, keep it simple: assign an owner, map your emission sources, pick a baseline year, gather utility and fuel data, and line up a verifier if rules require it. The goal isn’t perfect numbers tomorrow, it’s numbers you can defend, and improve, every cycle.