Energy teams already have the data. The real problem is getting a clear answer before another report, filter, or dashboard slows the work down.
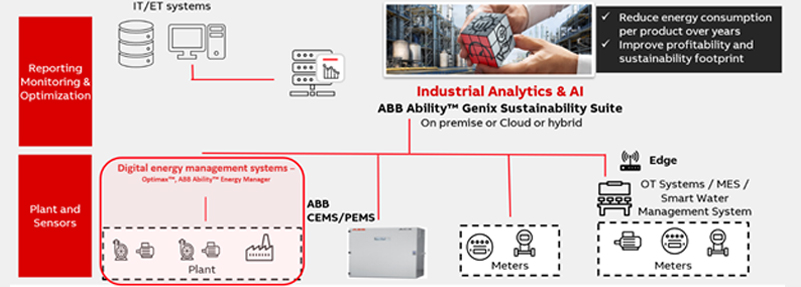
ABB’s latest message is simple: generative AI can help turn dense industrial energy data into plain-language answers, faster charts, and easier decisions. The company presented EMS Copilot as the next step in that shift, built on ABB Ability Industrial Knowledge Vault, or IKV.
What stands out is not only the AI layer, but where ABB is applying it first, inside the daily work of industrial energy management.
Generative AI is moving into day-to-day industrial work
Ruben Ramirez, ABB’s launch excellence manager, opened the session with a familiar truth. GenAI is no longer a side project. It’s spreading across industries at a speed that feels less like a slow wave and more like a surge that companies have to prepare for.
ABB backed that point with IDC figures cited during the presentation. GenAI usage rose from 55% to 78%, and organizations reported an average 3.7x return on investment for every dollar spent. Productivity-focused use cases delivered the strongest return for 43% of those organizations. ABB also pointed to projections of roughly 632 billion in GenAI investment between 2024 and 2028, plus a finding that 79% of CEOs surveyed plan to speed up GenAI work inside their companies.

Those numbers matter because industrial operations rarely adopt new software on hype alone. They need proof that a tool can save time, improve output, or help people spot problems earlier. ABB’s argument is that GenAI is starting to clear that bar.
The wider market points the same way. ABB’s own announcement on EMS Copilot frames the product around faster access to operational insight. Elsewhere in industrial software, similar ideas show up in tools like Schneider Electric Resource Advisor+ AI platform, where users ask for energy and carbon analysis in plain language instead of building every view by hand.
ABB used a wave analogy in the presentation, then said a tsunami might fit better. The point landed because it matched the mood in many plants today. You don’t stop this change. You get ready for it.
Industrial Knowledge Vault is the foundation under EMS Copilot
ABB did not start this story with EMS. It started with documents, know-how, and the problem of losing expertise.
The base layer is ABB Ability Industrial Knowledge Vault, which ABB launched as a knowledge ecosystem for retaining employee knowledge and making it easier to find. In its earlier form, customers could upload internal material into a document vault, then ask questions in natural language through a copilot interface. That made manuals, inspection procedures, engineering files, and reports easier to use without hunting through folders or waiting for a subject-matter expert.

ABB’s presenters described IKV as a way to keep institutional knowledge alive, then bring it back at the moment someone needs it. That matters in plants where experience often lives in a few people’s heads, scattered PDFs, and old reports that no one wants to dig up during a live issue.
EMS Copilot extends that same idea beyond documents. Instead of asking only about stored files, users can now ask questions against time-series data from the historian and the Energy Management System. In other words, ABB is combining two sources that usually stay apart: written knowledge and live operational data.
That combination is the part worth watching. A document can explain how a system should behave. Real-time and historical plant data can show how it actually behaves. When both sit behind one conversational layer, the user no longer has to switch between software views, reports, and binders just to answer one practical question.
Why ABB chose energy management first
ABB’s sustainability portfolio manager made the case for starting with EMS, and it was a practical one. Energy systems are rich with data, but they are often hard to query quickly.
The historian behind an EMS can contain readings at minute-level or even second-level intervals. Those records stretch across long periods, including monthly and yearly views. The model is also complex because it spans multiple plants, multiple processes and subprocesses, different utilities, and process variables tied to equipment behavior. That gives energy teams a lot to work with, but it also creates friction. Useful answers often hide behind layers of filters, dashboards, and fixed reports.
The goal, ABB said, is to move from complex reports and rigid software dashboards to simple conversational analytics.
That phrasing captures the appeal of EMS Copilot better than any product slogan could. Most users do not want one more screen. They want the answer, the chart, and enough context to trust it.
ABB also positioned this move as part of a clear progression. First came modernized EMS dashboards with a simpler user workflow. Then came time-series reports, which added more flexibility but still depended on setup work and later edits. After that, ABB connected EMS to Power BI, giving users more freedom to analyze and present data in their own format. Now the next step is GenAI, where one person can ask many kinds of questions without starting from a fixed template.
Large industrial sites make that jump easier to understand. At scale, the data volume becomes the problem. ABB’s work at the Al Dhafra solar farm hints at that challenge, with a control room processing more than 600,000 signals across the site. When systems reach that size, conversational access stops sounding like a convenience and starts sounding like a sensible interface choice.
What EMS Copilot can answer today
ABB said this is the first version of EMS Copilot, and the current scope already covers a wide range of useful questions. The common thread is that users ask in natural language and get either a number, a written answer, a chart, or a table.
This snapshot captures the main categories ABB showed:
| Question type | Example prompt | Typical output | | | | | | Total consumption analysis | What is the total cumulative energy consumption of mill number two in 2024? | Quantitative result, often followed by charts or breakdown tables | | Statistical analysis | What was the average daily energy consumption in 2025? | Averages, deviations, and other statistical views | | Trend and pattern analysis | What is the hourly steam consumption distribution of paper machine 1 in June 2024? | Trend lines, histograms, peak analysis | | Simple calculations | If electricity is EUR 50 per megawatt-hour and steam is EUR 30, what would the bill be? | Calculated totals with explanation | | Comparative analysis | Are there any days with difference in water consumption between paper machine 1 and 2 in June 2024? | Side-by-side comparison and chart suggestions |
The value is not only the variety. It is the speed of switching between question types. A user can start with total consumption, move into process-level ranking, add energy-type columns, then ask for emissions and get a pie chart without leaving the conversation.
ABB also said it connected the copilot to the existing EMS data model so the logic behind variables stays consistent. That matters because energy data only helps when names, units, and relationships stay intact across systems. On top of that, ABB said the module was trained around energy management domain knowledge and designed around the kinds of questions people really ask in this area.
Security came up as well. ABB said the full processing flow follows its cybersecurity guidelines, which is a basic requirement in industrial software, especially when plant data and internal documents can both feed the response.
A second benefit sits slightly in the background. ABB sees EMS Copilot as a way to reduce the need for a system expert every time a user wants a new report or a modified view. Longer term, the same approach could also speed up software configuration because configuration elements could be passed through the copilot in real time.
The demo showed how natural-language energy analysis works in practice
Kabir, ABB’s portfolio manager for connected workforce and asset performance, walked through a short demo that made the concept much easier to grasp. The starting point was a typical EMS homepage filled with energy and sustainability KPIs. In the demo system, ABB used simulated data, so some widgets were not populated and the emissions values were not meant to reflect a real plant. Even so, the workflow was clear.
On the overview page, one figure stood out: 508 gigawatt-hours for mill number two. Under the normal workflow, a user would click through navigation menus, dropdowns, and filters to get more detail. Kabir then opened EMS Copilot from the left-side menu and showed the alternate path.

The interface included a new chat option, a way to download conversation history, and a file manager for arranging documents inside the knowledge vault. ABB said users can upload maintenance procedures, inspection procedures, production or energy reports, engineering files, and other operational documents. When a question comes in, the copilot can pull from the EMS database, the document vault, or both.
The actual prompts covered a broad range. First, Kabir asked for the total cumulative energy consumption of mill number two in 2024. The system retrieved the result from the EMS database through an OData query. Next, he asked it to break the result down by key process areas, rank them from largest to smallest, and present the output in a table. Then he added consumption by energy type in columns and followed with a pie chart of emissions per energy type.
After that, the demo moved into trend analysis. EMS Copilot compared brown electricity consumption between May and June 2024. It then produced a line chart showing how brown electricity consumption changed in the pulp plant across June 2024 on a daily basis. For pattern analysis, Kabir asked for the hourly steam consumption distribution of paper machine 1 in June 2024, and the system returned a histogram.
The calculation examples were especially useful because they showed that EMS Copilot is not limited to simple retrieval. One prompt asked for a bill estimate for paper machine 1 on June 12, 2024, using a price of EUR 50 per megawatt-hour for electricity and EUR 30 per megawatt-hour for steam. Another prompt asked for the average emissions factor for paper machine 1 in June 2024 and requested an explanation based on both electricity and steam, which have different emissions footprints. ABB said that second answer relied on a weighted average calculation.
The final step was a comparison between paper machine 1 and paper machine 2, looking for differences in water consumption over June 2024. Then Kabir asked EMS Copilot to plot the data on a suitable chart and let the system choose the format. ABB also noted that the resulting charts are interactive, so users can select values, zoom in on sections, and provide feedback that goes back to the R&D team.
Energy grade monitoring adds product-level visibility
Alongside EMS Copilot, ABB also highlighted a new feature called energy grade monitoring. This part of the presentation was brief, but it matters because it links energy data to products rather than treating the plant as one undivided whole.
The feature helps users track utility consumption and emissions by product grade and product batch. ABB said operators can enter production plans by process, or the system can pull that information automatically from manufacturing systems. Once the data is in place, users can filter results to see the footprint of each product grade across energy types and utilities, including water.
That changes the conversation. Instead of asking only which plant area uses the most energy, teams can ask which product line carries the heavier energy or emissions burden. They can also calculate efficiency KPIs at the product level, which ABB framed as useful for regulatory compliance and product carbon footprint work.
This feature also lines up with a wider push in industrial software toward clearer sustainability reporting and product-level accountability. Similar themes appear in Resource Advisor+ for sustainability, where energy, carbon, and reporting workflows are tied together in one system. ABB’s angle here is more plant-focused, but the business pressure is the same: companies want to connect operating data to what they make, what they emit, and what they need to report.
For plants working toward sustainability goals, the promise is direct. If you can see the environmental impact of each product grade, you can focus on the parts of the portfolio that need the most work first.
Where ABB’s approach stands out
Plenty of software vendors now talk about AI assistants. What made this presentation more convincing is that ABB grounded the story in familiar industrial pain points: too many dashboards, too much filtering, too much time spent chasing one answer through different tools.
EMS Copilot does not replace the EMS itself. It sits on top of the historian, data model, dashboards, and document base that already exist. That means its value depends on the quality of the underlying data and structure. ABB was open about that, and it is the right framing. Conversational AI works better when the plant already has a trustworthy model underneath it.
The other strong point is scope. ABB did not present EMS Copilot as a magic fix for every plant workflow. It showed a first version with clear use cases: consumption queries, statistical analysis, trends, pattern detection, arithmetic scenarios, and comparisons. That measured approach makes the offering easier to assess.
For industrial energy teams, the appeal is plain. When a system can answer a question in natural language, build the right chart, and explain the result without a long setup cycle, it cuts friction out of routine analysis. In a plant setting, that time matters.
Final thoughts
ABB’s presentation made one idea hard to miss: the next useful step for industrial AI is not bigger dashboards. It is faster access to meaning.
EMS Copilot works because it meets users where the problem starts, inside messy real-world energy data, buried documents, and limited time. If ABB keeps improving the model coverage and keeps the answers grounded in plant data, this kind of conversational interface could become a normal part of industrial energy work rather than a novelty.