If your energy bills sit in one system, emissions data sits in spreadsheets, and supplier numbers arrive late (or not at all), decisions drag. Teams waste time arguing about whose data is right instead of fixing what’s wrong.
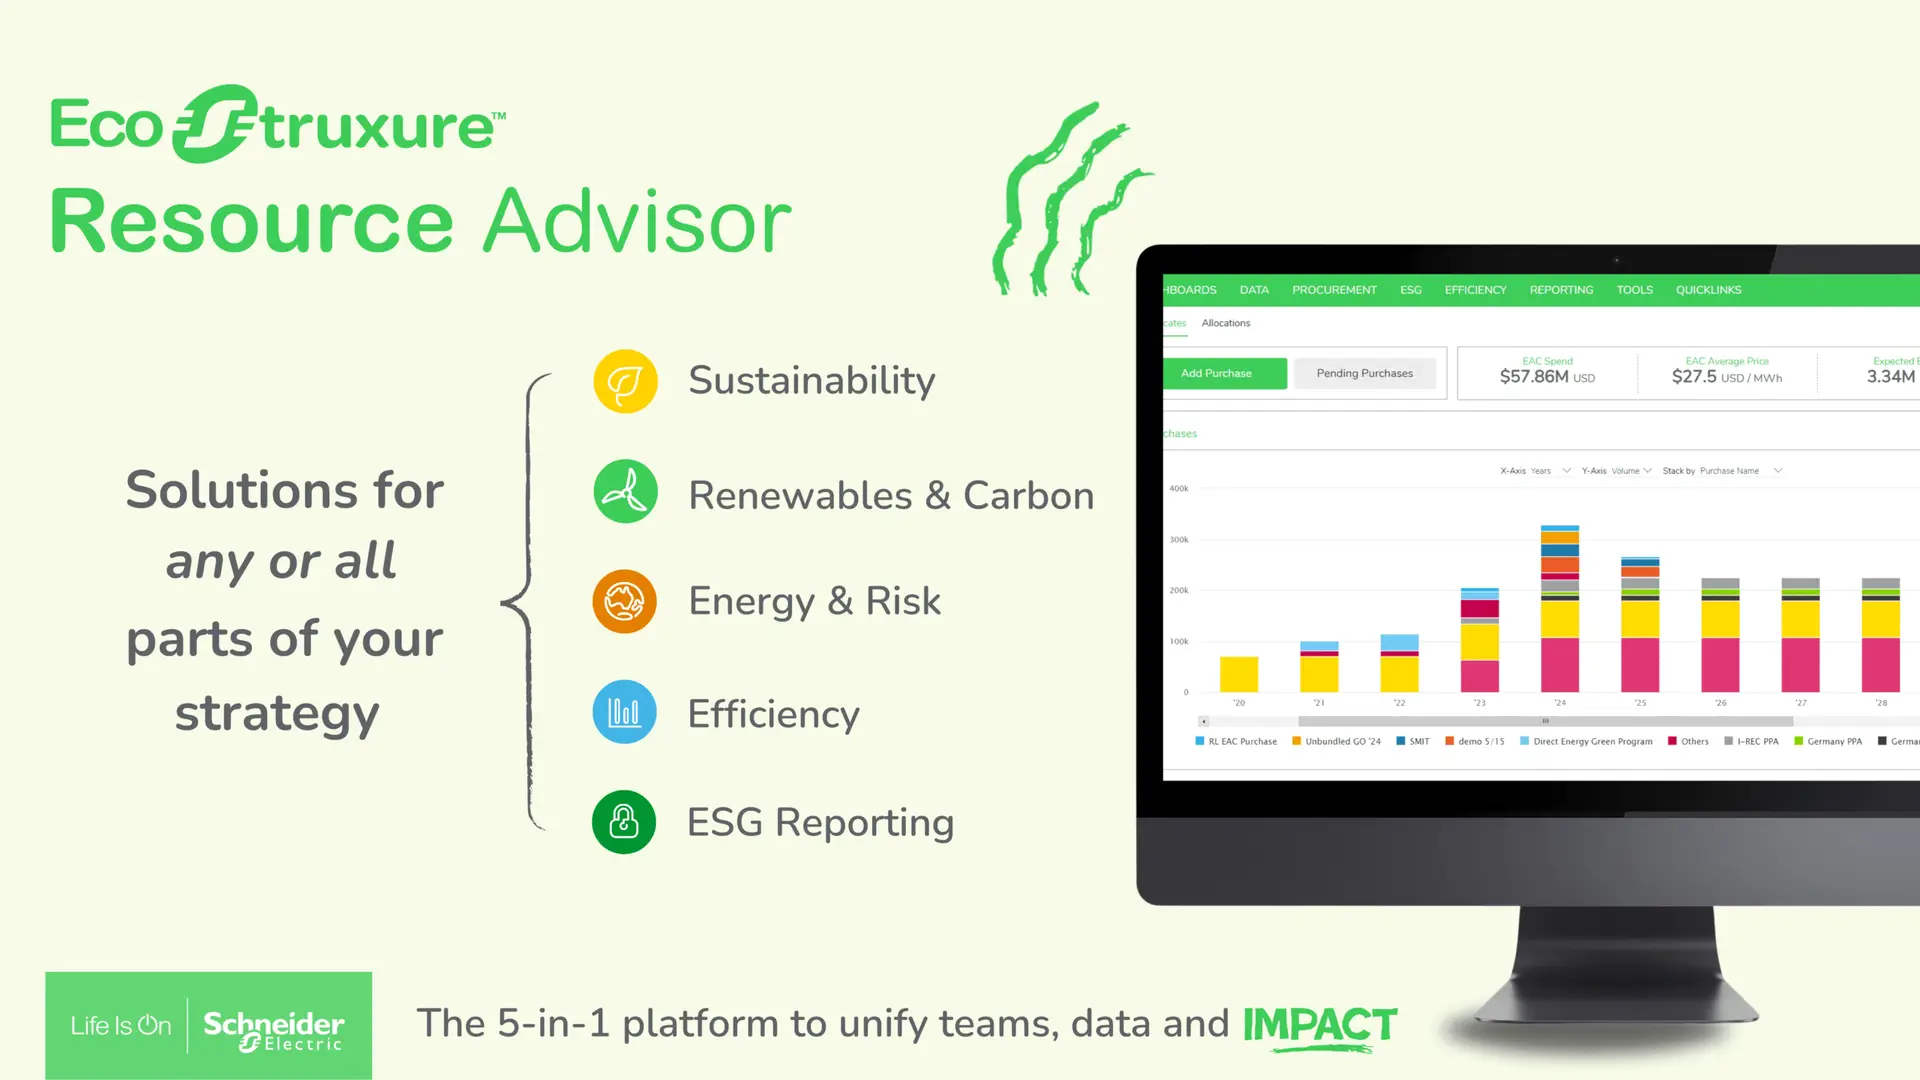
Schneider Electric Resource Advisor Plus (often written as Resource Advisor+) is built for that exact problem. It’s an AI-supported platform that brings energy, carbon (Scopes 1 to 3), supply chain data, and climate risk signals into one workflow, then helps turn that mess into actions you can track.
This guide explains what people actually do in the tool each week, how data becomes trusted results, what to ask in a demo, and how it differs from DCIM and older energy platforms.
What Resource Advisor Plus does day to day (beyond dashboards)
Resource Advisor+ builds on the long-running EcoStruxure Resource Advisor foundation, but it adds a broader sustainability scope and an AI layer to speed up analysis and follow-up. In practice, the weekly work looks less like “build a chart” and more like “close a loop.”
Most teams use it to keep four cycles moving:
- Data intake and cleanup: confirm utility bills, fix mapping issues (sites, meters, accounts), and lock reporting periods.
- Performance checks: compare sites, spot abnormal usage, and separate weather effects from operational problems.
- Emissions operations: generate Scope 1 and 2 results on schedule, then expand Scope 3 coverage without breaking the process.
- Project and program tracking: document energy projects, savings, and progress toward internal targets, with evidence that survives audits.
Schneider positioned Resource Advisor+ as an “AI-first” evolution of its advisory platform, with early coverage centered on carbon performance and supply chain workflows, alongside established energy data management capabilities. For background on the January 2026 launch framing, see the Resource Advisor+ announcement summary.
The main jobs it helps with: energy, emissions (Scopes 1 to 3), supply chain, and climate risk
Energy management starts with basic truth: which sites used what, when, and at what price. A typical example is tracking electricity use per site, then normalizing it by square footage or production output to spot underperformers.
Scope 1 and 2 emissions depend on clean activity data and controlled factors. For Scope 2, teams often need both location-based and market-based numbers, plus a clear record of which method was used for each report.
Scope 3 supply chain work is where most programs stall. Resource Advisor+ is designed to collect supplier emissions inputs, track who responded, and keep an audit trail for follow-ups. That matters because Scope 3 data is rarely “one and done.” It’s more like tuning an instrument; you improve coverage each cycle.
Climate risk becomes useful when it’s tied to locations that matter. For example, if a coastal distribution center faces higher flood exposure, that risk should connect to a capital plan, insurance review, or supplier reroute discussion, not just a slide in an ESG deck.
The goal across all four areas is the same: one source of truth that supports decisions, not just reporting.
Sera AI Agent, what it is and how it changes the workflow
Sera is the AI agent inside Resource Advisor+ that turns a request into an analysis, then into a short plan. Instead of exporting data to build your own logic, you ask for an outcome, for example, “Which sites drove last month’s spike?” or “What actions cut emissions fastest this quarter?” Sera routes that work through specialized analysis and return plain outputs:
- What’s happening (trend, anomaly, gap to target)
- Why it matters (cost, risk, reporting impact)
- What to do next (ranked actions, owners, timing)
- How to measure it (baseline, expected savings, verification plan)
That last point is the difference between “AI insight” and operational value. If you can’t measure it, finance won’t trust it, and operations won’t prioritize it.
How it works under the hood, from data intake to trusted results
Every analytics platform has the same failure mode: bad inputs create confident-looking outputs. Resource Advisor+ reduces that risk by forcing structure around data intake, review, and change control.
At a high level, the flow is simple. First, data comes in from bills, meters, systems, and suppliers. Next, the platform aligns it to common definitions (sites, time periods, units, categories). Then it runs checks, flags issues, and supports approvals. Finally, it produces reports, action lists, and project tracking that connect back to the original sources.
If you can’t answer “who approves this data,” you don’t have governance, you have hope.
Clear ownership matters. Someone needs to review bills, someone needs to control emissions factors and methodologies, and someone needs to manage supplier outreach and evidence.
Where the data comes from, and what “unified” really means
Most implementations pull from a mix of:
- Utility bills and invoices (electric, gas, water, waste)
- Interval meters and building systems (BMS, submeters)
- Facility records (site attributes, floor area, operating hours)
- Procurement and supplier submissions for Scope 3
- Spreadsheets that still run parts of the program
- Existing ESG reporting tools that require exports
“Unified” doesn’t mean everything becomes identical. It means the platform keeps consistent site lists, time windows, units, and categories, so totals match across reports. It also means you can trace an emissions figure back to the activity data and the factor used to calculate it.
If your metering layer needs improvement, pairing the platform with robust electrical visibility can help. For a practical look at enterprise meter and power quality monitoring, see Schneider Electric Power Monitoring Expert (PME).
How the platform finds issues and turns them into actions
Resource Advisor+ focuses on controls that prevent surprises and reduce manual hunting:
Bill validation catches invoice errors and mismatched rates before payments lock in. That’s direct savings, not “insight.”
Anomaly alerts highlight spikes, missing intervals, and drift from expected patterns. As a result, teams fix issues earlier, when root causes are still visible.
Site benchmarking shows which buildings or plants are off track against peers. That helps ops teams prioritize, because nobody has time to investigate every site every month.
Project tracking links actions to outcomes. Efficiency upgrades, control changes, or equipment replacements need baselines, expected savings, and verification steps. Otherwise, the “savings” live only in a slide.
Who should consider Resource Advisor Plus, and what to ask before buying
Resource Advisor+ fits best when energy and sustainability work spans many sites, several regions, or a complex supplier base. It’s also a strong fit when reports must stand up to audits, board review, or customer scrutiny.
Common stakeholders include energy managers, sustainability leads, procurement, finance, EHS, and operations. Each group cares about different outputs, so the buying process should start with shared outcomes, not features. Also, expect quote-based pricing that varies by scope, data sources, and modules.
Best-fit scenarios, and signs you might not need it yet
Best-fit signals usually look like this: high energy spend, multi-site operations, formal emissions targets, pressure to quantify Scope 3, and repeated requests for “one number everyone agrees on.”
On the other hand, some organizations won’t get value yet. If you have a tiny footprint, only a few bills, no supplier program, and no owner for data governance, a lighter utility tracker may be enough for now. Tools don’t fix ownership gaps.
Demo checklist: questions that uncover real value and total effort
Use the demo to uncover effort, not just screens:
- What’s the implementation timeline, and what work stays on our side?
- How do you onboard and validate utility bills and interval data?
- How do we manage Scopes 1 and 2 methodology choices, approvals, and audit logs?
- What does the Scope 3 supplier process look like (collection, reminders, evidence storage)?
- How is climate risk tied to our site list and material locations?
- How do alerts, approvals, and roles work across energy, carbon, and procurement?
- What exports and reporting formats do we need for ESG, finance, and customers?
- When Sera recommends an action, how does it explain assumptions and expected impact?
Ask for a pilot plan with success metrics, for example time saved in monthly close, bill error catch rate, emissions coverage percent, and supplier response rate.
Resource Advisor Plus vs EcoStruxure Resource Advisor and DCIM tools: what’s different
It’s easy to mix these categories because they all show energy charts. The difference is the operating target.
DCIM tools focus on data center infrastructure: power, cooling, space, assets, and uptime constraints. Resource Advisor+ targets enterprise-wide energy and sustainability operations, including supply chain and risk. EcoStruxure Resource Advisor (classic) sits closer to energy data management and reporting, while “Plus” extends the scope and adds AI-supported guidance.
Here’s a quick way to compare:
| Area | Resource Advisor+ | EcoStruxure Resource Advisor (classic) | DCIM tools |
|---|---|---|---|
| Primary focus | Enterprise energy, carbon, supply chain, risk | Energy and resource data management | Data center ops (power, cooling, assets) |
| AI-guided workflow | Yes, via Sera | Limited compared to Plus | Varies by vendor, often ops-focused |
| Scope 3 supplier coverage | Built in (module-based) | Typically lighter | Not the main goal |
What you gain with the “Plus” platform, and what stays the same
With “Plus,” you gain a control-center approach that reduces tool sprawl: broader sustainability coverage, AI-supported next steps, and better continuity between reporting and execution.
At the same time, the unglamorous parts still matter. Bill checks, budgets, benchmarking, alarms, and project tracking are the systems that keep programs honest month after month. If those basics are weak, AI won’t save the program, it’ll just summarize the confusion faster. For Schneider’s current framing of Sera and the platform’s scope, review the Resource Advisor+ platform overview.
Conclusion
If you need one place for energy, carbon, suppliers, and climate risk, and you want AI-supported next steps, Schneider Electric Resource Advisor Plus deserves a serious demo. If your main need is data center operations, or basic bill tracking for a small footprint, narrower tools can fit better.
Next, write down your top three outcomes (cost savings, emissions coverage, supplier Scope 3 progress), then take the demo checklist and test whether the platform can prove those results in a pilot.


![Voltage Sag vs Interruption: Causes, Impact, and Fixes A plant can lose a production line from a blink of power, even when the lights come back almost at once. If you've seen a VFD trip, a contactor drop out, or a PLC reset after a split-second dip, you've seen power quality turn into a production problem. The issue is often not a full outage. It's a short voltage event that sensitive equipment can't ride through. Start with the basics, and the failure starts to make sense. What voltage sag and interruption mean A voltage sag is a short drop in RMS voltage below normal, usually to 10% to 90% of rated voltage, for 0.5 cycles up to 1 minute. In a 415 V system, a brief drop to 280 V or 250 V is a sag, not a blackout. Duration matters. If voltage stays low for more than a minute, that is usually undervoltage, not sag. A sag arrives fast, recovers fast, and can still stop a machine. This quick comparison makes the difference easier to see: EventWhat happensTypical durationVoltage sagVoltage drops but does not go to zero0.5 cycles to 1 minuteVoltage interruptionVoltage is zero or near zeroLess than 1 minuteUndervoltageVoltage stays below normal for longerMore than 1 minute An interruption is more severe because supply is lost completely, or almost completely, for less than a minute. If it clears in a few seconds after auto-reclosing, it is a momentary interruption. If it stays off beyond a minute, it becomes a sustained interruption. Why these events happen The most common cause is a fault on the power system. That could be a single line-to-ground fault, line-to-line fault, double line-to-ground fault, or a three-phase fault. When fault current rises, voltage drops across the network until protection clears the problem. If the fault is on your feeder, you may see a sag first and then an interruption when the breaker opens. If the fault is on another feeder from the same substation, your breaker may never trip, but your plant can still see a bus voltage dip. That is why equipment can trip even when "our feeder never opened." Large motor starting is another frequent cause. An induction motor can draw five to seven times full-load current during start. In a weak system, or where the motor is large compared with the transformer, that inrush can create a temporary sag. Transformer energization, capacitor switching, welding loads, arc furnaces, and sudden heavy loading can do the same. Why a tiny dip can stop a large machine > The main motor may ride through a sag, but the control power often won't. Older plants had more electromechanical loads, and many of them tolerated short dips. Modern plants rely on PLCs, VFDs, servo drives, electronic power supplies, sensors, relays, and SCADA. Those devices make automation possible, but many are more sensitive to voltage dips than the motor they control. Massive steel control panels and heavy machinery dominate the floor as overhead lights cast a chaotic, flickering glow. Sharp shadows and sparks suggest a sudden surge in the facility power grid. [https://user-images.rightblogger.com/ai/f382171e-d1b1-4320-b7eb-289d9b53ee27/industrial-factory-power-instability-93e17dc7.jpg] A short sag may not stop a spinning motor because inertia keeps it moving. Still, the contactor coil can drop out, the VFD can detect undervoltage, and the PLC power supply can reset. Once the control chain breaks, the process stops. In process plants, that can mean lost batches, reset time, scrap, labor loss, and delayed delivery. Magnitude and duration both matter. Some equipment can tolerate 80% voltage for five cycles, but not 40% for the same time. That is why ride-through curves matter, and why event recording matters too. Good monitoring tools, such as monitoring power quality with PME 2024 R2 [https://www.interestingautomation.com/schneider-pme-2024-r2/], help capture minimum voltage, duration, and affected phases. Practical ways to reduce voltage sag problems The most cost-effective fix starts with the weak point. If a 200 kW machine trips because a 230 V PLC supply resets, you usually do not need to protect the whole machine. You need to protect the control power. * Specify ride-through performance when buying critical PLCs, drives, relays, and controls. * Add a small UPS, DC backup, or capacitor ride-through module for control power. * Use a voltage sag compensator or dynamic voltage restorer for sensitive process loads. * Apply online UPS systems where transfer time cannot be tolerated. * Consider motor-generator or flywheel systems where short interruptions happen often. * Use static transfer switches only when the two sources are truly independent. Source quality matters too. Utilities reduce events with better protection coordination, faster fault clearing, line maintenance, tree trimming, and feeder automation. On the plant side, grid automation and fault visibility also help, which is why tools for using Easergy T300 for fault detection [https://www.interestingautomation.com/brief-explain-easergy-t300-features-benefits-and-complete-guide/] are relevant in systems that need faster disturbance response. Final thoughts A blink in voltage can do more damage to production than a short outage, because the failure often happens inside the control system before anyone sees a breaker trip. That is the core lesson behind voltage sag and interruption studies. The best fix is rarely the biggest one. Find what actually trips, measure how deep and how long the event lasts, and protect the most sensitive part first. A brief dip should not turn into hours of downtime.](https://www.interestingautomation.com/wp-content/uploads/2026/05/Voltage-Sag-vs-Interruption-Causes-Impact-and-Fixes-150x150.jpg)


![Why MV Switchgear Fails: 5 Causes That Lead to Major Faults A 36 kV switchgear panel can sit closed for two years, carry load without complaint, and still fail on the one day you need it to clear a fault. That is the risk hiding behind a quiet panel. If the breaker won't trip, if protection doesn't detect the fault, or if insulation breaks down inside the cubicle, the result can be fire, arc flash, equipment loss, and a hard production stop. The real job is not waiting for failure and reacting later. It is spotting the warning signs before the panel runs out of margin. What counts as a switchgear failure Not every defect in a medium-voltage panel is a true failure. That distinction matters because reliability studies do not count every bad lamp, loose label, or minor nuisance the same way they count a breaker that won't trip. IEC 62271-1, clause 3.1.12, defines a major failure as a failure of switchgear and controlgear that causes the loss of one or more fundamental functions. It also says a major failure leads to an immediate change in system operating conditions, such as backup protection having to clear a fault, or forces unscheduled removal from service within 30 minutes. Major failures affect the core job of the panel In plain language, a major failure means the switchgear can no longer do one of its main jobs. Those jobs include switching, protection, monitoring, and control. If a fault occurs and the protection system does not detect it, that is a major failure. If the relay sends a trip command and the vacuum circuit breaker stays closed, that is also a major failure. The same goes for a situation where one bus section fails and the plant has to shift supply to another bus to keep running. The standard's wording about "immediate change in operating conditions" is useful because it points to real plant behavior, not theory. When primary protection fails and backup protection has to step in, the system has already moved into an abnormal state. If a breaker will not close because of a spring problem and must be removed from service at once, the equipment has lost its reliability. Minor failures are different, even if they still need attention A minor failure is anything that does not take away those core functions. An LED indication lamp that has gone dark is annoying, but it does not stop the panel from switching or protecting the system. A cosmetic defect may need correction, but it does not belong in the same category as a breaker mechanism that sticks. That distinction helps when you look at failure data. Most reliability studies focus on major failures, because those are the events that threaten safety, uptime, and equipment life. > A panel does not become dangerous only when it burns. It becomes dangerous the moment it can no longer switch, protect, or isolate a fault as intended. The five failure modes behind most serious problems Across published guidance and field experience, the same trouble spots keep showing up in MV switchgear. Insulation breakdown and mechanical faults sit near the top, while overheating, environmental stress, and aging keep chipping away at the system until something gives. A single medium voltage switchgear panel stands inside a clean and brightly lit industrial facility. [https://user-images.rightblogger.com/ai/f382171e-d1b1-4320-b7eb-289d9b53ee27/medium-voltage-switchgear-panel-dc9d5203.jpg] This quick summary helps frame where the risk usually sits: | Failure mode | Typical share or impact | Common triggers | Best early warning | | | | | | | Insulation failure | About 20% to 30% of failures | Partial discharge, insulation defects, contamination | PD testing or continuous PD monitoring | | Internal arc | Less about share, more about severity | Insulation breakdown, loose parts, human error, foreign objects | Arc detection plus proper panel design and rating | | Busbar and connection overheating | Major contributor within remaining failures | Poor joints, high contact resistance, loose terminations | Thermal inspection or continuous temperature monitoring | | Environmental and aging effects | Significant long-term driver | Moisture, dust, corrosion, seal failure, material degradation | Inspection, humidity monitoring, life assessment | | Mechanical failures | About 30% to 40% of failures | Trip coil issues, dry lubrication, worn parts, weak spring energy | Breaker monitoring and functional testing | The headline is simple. A switchgear failure usually starts as a small loss of margin, then turns into a major event when nobody is watching. Insulation failure usually starts where you can't see it Insulation failure is one of the biggest reasons MV switchgear fails. The hard part is that the panel can look healthy from the outside while the weakness grows inside cable insulation, busbar insulation, or instrument transformer resin. Partial discharge is small at first, then destructive Partial discharge starts when electrical stress concentrates inside tiny voids, impurities, or defects within insulation. In a cable, for example, a manufacturing void or a badly prepared termination can create a weak point. Stress collects there because the local dielectric strength is lower. Once the stress exceeds what that spot can withstand, a localized discharge starts. It is called "partial" because the discharge does not bridge the full insulation path at first. Still, the damage does not stay small. Repeated discharges eat away at the insulation until a much larger fault develops. A wood beam with termites offers a good comparison. The outside may still look sound, while the inside has already lost strength. By the time the damage is visible, the collapse is close. In MV panels, partial discharge often shows up in cable terminations, cable insulation itself, CT and VT epoxy insulation, and insulated busbar systems. The danger is that it rarely gives an obvious warning unless you are looking for it. For a broader research view, the review of medium-voltage switchgear fault detection [https://www.mdpi.com/1996-1073/15/18/6762] covers common detection methods and fault behavior in more detail. Periodic partial discharge testing helps, but it has a limit. You only see the panel at the moment of the test. Continuous monitoring fills the blind spot between maintenance visits. That difference matters more as the switchgear ages. Internal arc is where hidden weakness becomes immediate danger Internal arc is one of the worst events that can happen inside switchgear because it combines heat, pressure, smoke, and metal vapor in a confined space. It is not the same thing as a normal short circuit. An internal arc is a fault that develops inside the enclosure and puts people nearby at direct risk. Insulation failure can trigger it. So can a loose connection, a dropped tool, a foreign object left behind after maintenance, or simple human error. A screwdriver bridging two phases is enough to turn a routine task into a violent event. Besides fire damage, the smoke from an internal arc is hazardous on its own. That is why this topic is not only about asset protection. It is also about human safety. Modern panels may include arc detection systems that watch for both light and current. When they detect an arc, they send a trip command in milliseconds. It also pays to check whether the panel has been tested for internal arc classification, because that tells you how the equipment is expected to behave during this kind of fault. Heat at joints and contacts can undo a good panel Every electrical joint carries some risk. If the connection is poor, resistance rises. When current keeps flowing through that resistance, I squared R losses turn into heat, and heat becomes the start of the next failure. This issue appears again and again at busbar joints, cable terminations, breaker contacts, and earthing connections. The busbar connection between two panels is a common weak point. So is the cable end where termination quality depends on careful stripping, clean surfaces, correct materials, and proper tightening. In withdrawable breakers, primary contact engagement needs extra attention because poor seating can cause local hot spots. The physics is simple, but the effect is expensive. A small increase in contact resistance can push the temperature high enough to damage insulation, oxidize surfaces, weaken spring pressure, and set up the next arc fault. That is why overheating is a recurring theme in switchgear failure analysis, including this overview of switchgear failures and solutions [https://blog.exertherm.com/causes-of-switchgear-failures-and-solutions]. Good workmanship cuts most of this risk at the start. Joints need the right preparation, the right torque, and the right method from the manufacturer. After installation, thermal checks matter. A handheld IR inspection helps during rounds, but large sites with many panels often need more than occasional scans. Fixed thermal sensors on critical joints can track temperature all day and flag a problem before the panel forces a shutdown. Age and environment wear down the margin of safety Switchgear does not fail only because something was assembled badly. Time and environment also wear down the panel, even when operation looks normal. A typical service life is often described as about 25 to 30 years, though real life depends on duty, environment, maintenance, and design. Once equipment gets deep into that age range, the risk rises. Insulation can crack. Corrosion can creep across sheet metal and hardware. Seals can weaken in gas-filled compartments. Contacts wear. Springs lose strength. Materials that looked stable for years start to drift out of their original condition. Environmental stress speeds that process up. Moisture is a common problem because it lowers insulation resistance and can help contamination become conductive. Dust does the same thing when it settles where it should not. Some reported failure summaries tie a large share of busbar trouble to moisture and dust exposure, and this medium-voltage switchgear problem summary [https://www.green-energy-elec.com/common-problems-in-medium-voltage-switchgear/] highlights that pattern clearly. The fix depends on the site. Air-insulated panels in humid, dusty areas need more cleaning and inspection. Higher IP ratings help when the environment is harsh. In some applications, enclosed technologies such as GIS or solid-insulated systems reduce exposure. Humidity sensors inside selected panels also help, because they warn you when the room condition and the cubicle condition are drifting apart. Mechanical failures stop the breaker when it matters most Mechanical trouble is often the biggest single contributor to MV switchgear failure. That makes sense because a fault may be detected perfectly, yet the system still fails if the breaker mechanism cannot move. A breaker that has stayed closed for two years can look healthy, but that does not prove it will trip on demand. The trip coil may be open or shorted. Lubrication may have dried out or picked up contamination. Stored-energy springs may have weakened. Linkages may seize. Contacts may be worn. Any one of those problems can turn a valid trip command into a non-event. That is the nightmare scenario in a live plant. Fault current continues to flow because the breaker remains closed. Backup protection may clear the fault later, but the delay can mean heavier equipment damage, a wider outage, and greater risk to people nearby. Routine maintenance helps because it proves the mechanism can still move. Still, periodic checks have gaps. A breaker can pass a test in January and develop a mechanical issue in March. That is why breaker monitoring is gaining ground. Modern systems can track operating count, contact wear, gas or pressure status where relevant, opening and closing speed, and other health indicators that point to a weakening mechanism. For teams that already use connected diagnostics on breakers, tools such as a Pact series breaker diagnostic and testing interface [https://www.interestingautomation.com/schneider-electric-service-interface-kit-pact-series-circuit-breakers-installation-compatibility-expert-review/] show how live measurements and event data can shorten troubleshooting time and expose developing faults before a trip failure happens. > A breaker is not reliable because it stayed closed. It is reliable because you have evidence that it can still open. Why monitoring beats calendar-based maintenance alone Traditional maintenance still matters. Panels need cleaning, inspection, tightening, lubrication, and testing. Yet calendar-based maintenance only gives you snapshots. It cannot tell you what happened between visits. Monitoring changes that. A continuous system can watch temperature rise at a joint, catch partial discharge activity, track humidity inside a cubicle, and record breaker operation data around the clock. It also makes condition-based maintenance possible. Instead of opening equipment on a fixed calendar, you act when data shows the condition is changing. That approach is often the difference between "repair after failure" and "intervene before failure." On new switchgear, you may not need every sensor from day one. On older panels, on hard-worked breakers, or across a large fleet, the case for monitoring becomes much stronger. A plant-wide supervision layer also helps because raw data is not enough by itself. Operators need one place to see alarms, status changes, and events in context. Platforms focused on real-time monitoring with Schneider EPAS [https://www.interestingautomation.com/schneider-electric-epas/] show why visibility matters when a feeder trips or a breaker changes state. Faster fault isolation starts with seeing the right information at the right time. Final thoughts The most dangerous switchgear failures do not start with a dramatic event. They start with a missed warning, a weak joint, a dry mechanism, or insulation that is breaking down in silence. If there is one takeaway to keep, it is this: reliability needs proof. A breaker that has been closed for two years is only comforting when you know it can still trip today, and the rest of the panel can still do its core job when the fault arrives.](https://www.interestingautomation.com/wp-content/uploads/2026/05/Why-MV-Switchgear-Fails-5-Causes-That-Lead-to-Major-Faults-150x150.jpg)