“As the AI wave surges, digital transformation permeates every aspect of human civilization.” That statement lands because power distribution already runs on data, whether you can see it or not. When loads increase and uptime matters, teams need real-time visibility into thermal and electrical conditions, not just periodic checks.
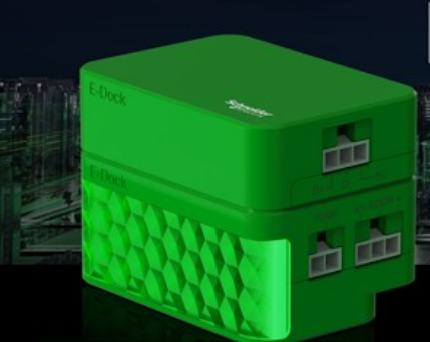
Schneider Electric positions PowerLogic E-Dock as a digital busway monitoring solution built for that reality. It combines local processing, clear on-device status, and modular sensing so operators can track temperature, water leakage (when equipped), and power, then use analytics to spot risk earlier and plan maintenance with better timing.
Why AI is showing up in power distribution hardware
AI only helps when the input signals are trustworthy and consistent. In busway systems, that starts with the basics: temperature at key points, current behavior at each node, and system health indicators that are easy to confirm during a walk-through. Traditional protection devices still matter, but they usually respond after a limit is crossed. By contrast, continuous monitoring can highlight a drift toward unsafe conditions while there’s still time to act.
That’s the core idea behind Schneider Electric’s messaging around an AI-driven transformation for power distribution. Busway is often chosen for flexible distribution and high current capacity, yet it can be hard to instrument at scale if sensors are bulky, difficult to mount, or inconsistent across busway types. When monitoring hardware is simple to deploy, data coverage improves. Better coverage then supports better analytics.
A useful analogy is condition monitoring on rotating equipment. Vibration trending works because sensors stay in place and produce comparable readings over time. Thermal trending on electrical distribution needs the same qualities: stable measurement points, clear alarms, and a way to expand as the installation grows.
For a related example of why continuous thermal visibility matters, see this internal reference on cable temperature monitoring with TH110. While it focuses on cables, the risk pattern (hot spots, slow drift, and hard-to-see failures) is similar to what busway owners try to control.
The value of AI in power systems depends less on dashboards and more on the quality, coverage, and stability of the underlying measurements.
What PowerLogic E-Dock is in Schneider Electric’s digital bus solution
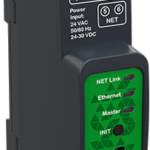
PowerLogic E-Dock is presented as a busway-specific monitoring module that adds intelligence to busway distribution. At the center is the E-Dock core module, which uses a dedicated processing chip intended to provide reliable computing at the point of installation. In practical terms, local processing supports predictable device behavior, consistent status reporting, and stable handling of multiple feature modules.
The physical concept also matters. Busway runs can include different layouts, tap-off points, and site constraints. Schneider Electric highlights a compact, flexible design, with easier installation across busway types. It also supports both factory pre-fit and field retrofit scenarios, which is important because many facilities add monitoring after the busway is already in service.
That pre-fit versus retrofit support changes the project path:
- With factory pre-fit, monitoring can be planned during design and commissioning, with standardization across runs and nodes.
- With field retrofit, teams can add monitoring where risk is highest first (for example, higher-load segments), then expand coverage later.
Even though E-Dock is described as a module, the intent is broader than a single sensor. It is a building block for “Digital Bus 2.0” in Schneider Electric’s wording, where busway becomes a data source for operations, maintenance planning, and alerting.
If you want context on how Schneider Electric often ties power instrumentation to software workflows, this internal overview of Schneider Power Monitoring Expert (PME) is a helpful background read for understanding the types of data and alarms many facilities already rely on.
Visual status, LED indication, and why it matters during operations
A monitoring system fails fast when field teams can’t trust what they see. That’s why the E-Dock emphasis on intuitive visual status and clear LED indication is not a small feature. It supports a basic operational need: confirming device state without opening software, hunting for a gateway, or scheduling a specialist to interpret logs.
In day-to-day work, quick visual checks reduce time-to-triage. If an alarm occurs, technicians can verify whether it is local to a node or part of a wider issue. Clear indication also helps during commissioning and after maintenance, when teams want confirmation that the monitoring point is active and reporting.
The video description also points to what those indicators represent. The intent is real-time visibility into temperature, power, and overall system health. That aligns with a modern maintenance workflow where operators prefer quick confirmation at the equipment, then deeper analysis in software.
Scalable monitoring with optional modules
E-Dock is described as scalable, with flexible, multi-feature expansion. Practically, that means you can start with the standard function set and add capabilities where they are needed.
Standard features called out include:
- Temperature monitoring
- Over-temperature alerts
Optional modules extend that baseline:
- Water leakage alerts
- Power monitoring
This modular approach fits how busway is used in real facilities. A data hall, manufacturing line, or critical mechanical room might justify more electrical detail and environmental sensing, while a low-risk segment may only need temperature thresholds.
For broader context on how distributed sensors are often deployed for electrical measurements, this internal page on PowerLogic PowerTag features explains the general idea of adding measurement points without heavy rewiring.
The integrated data highway: turning measurements into usable signals
Collecting data is only step one. The transcript describes an integrated data highway that combines temperature, water leakage, and power data. This is the layer that makes correlation possible. When you can view multiple signals together, you reduce guesswork.
Consider a few common fault patterns:
- A rising temperature trend with stable current can suggest a connection issue or localized resistance increase.
- A temperature spike that matches a load increase may be normal, but it still requires verification against expected ranges.
- A water leakage alert near a busway segment can change how urgently you treat insulation and contamination risks, even before electrical readings drift.
In other words, combined signals improve diagnostic speed. They also support better alert logic. Instead of simple, fixed thresholds for every condition, the system can compare a node against its expected behavior.
Schneider Electric describes a busway AI model built from specialized modeling, testing, and real-world data. That matters because thermal behavior depends on load profile, installation environment, and how heat dissipates along the run. A model that accounts for varying loads can produce more useful alerts than a one-size threshold.
What Schneider Electric’s busway AI model claims to predict
The transcript lists several AI-driven outcomes. These are not generic statements about “smart monitoring.” They map to specific signals operators care about: node temperature, current peaks, load-dependent behavior, and maintenance planning based on trends.
Capabilities described include:
- Predicted over-temperature alerts under varying loads
- Real-time peak current alerts per node
- Prediction of normal node temperature ranges
- Forecasts of temperature at full load
- Predictive maintenance through temperature trend analysis
Each item addresses a real operational problem. Fixed alarm limits often trigger too late or trigger too often. By estimating normal ranges per node, alerting can become more targeted. Similarly, forecasting temperature at full load supports capacity planning because it helps teams understand thermal headroom before adding load.
Trend-based maintenance is also practical. A slow rise in temperature over weeks can signal loosening hardware, contamination, or aging surfaces. Catching that pattern early reduces the chance of heat damage and unexpected downtime.
For more background on the broader push toward AI in facilities and operations, this third-party coverage of Schneider Electric’s unified AI-powered platform for buildings gives additional context on how Schneider is packaging analytics across building and energy systems.
Cybersecurity and built-in protection in a connected busway system
Once monitoring becomes connected, the threat model changes. You are no longer protecting only copper and insulation. You also need to protect data paths, device integrity, and the availability of monitoring signals during events.
Schneider Electric calls out comprehensive cybersecurity and built-in protection as part of the Digital Bus 2.0 concept. While the transcript doesn’t list specific security mechanisms, the point is clear: adding connectivity should not create an unprotected entry point into an electrical monitoring environment.
The table below summarizes the operational difference between conventional monitoring and an AI-ready approach as described in the video.
| Area | Conventional monitoring approach | AI-ready approach described for Digital Bus 2.0 |
|---|---|---|
| Temperature alerts | Fixed thresholds and basic alarms | Predicted over-temperature alerts under varying loads |
| Current visibility | Often limited to upstream metering | Real-time peak current alerts per node |
| Maintenance planning | Periodic inspections, reactive fixes | Predictive maintenance using temperature trends |
| System expansion | Hard to scale without redesign | Modular expansion for added features |
| Connected risk | Less exposure if isolated | Cybersecurity and built-in protection emphasized |
The key takeaway is that smarter alerting increases the need for strong protection. If teams act on predictive alarms, they must trust that signals are authentic, available, and not easily disrupted.
For vendor documentation on the PowerLogic ecosystem itself, Schneider Electric publishes catalogs such as the PowerLogic energy and power meters catalog for panel builders, which helps explain where busway monitoring can sit alongside metering and power quality tools in a single measurement strategy.
Digital Bus 2.0 in practice: where E-Dock fits and what to do next
Schneider Electric frames this as “Schneider Electric Digital Bus 2.0,” followed by the tagline, “Embrace AI. Connect the future.” In practice, the message is that busway should become a measurable asset, not a blind spot between switchgear and loads.
E-Dock sits at the node level, where temperature and load behavior can be observed directly. That makes it relevant in busway-heavy installations such as commercial facilities, industrial plants, and data centers, especially where changes happen often and capacity margins are tight.
A reasonable next step is to map which busway segments carry the highest risk. High current density, frequent load changes, and difficult access usually define the first monitoring points. From there, modular expansion can add water leakage or power monitoring where it improves diagnostics.
For official Schneider Electric resources referenced by the channel, these links are a practical starting point for product context and support paths:
- Schneider Electric global website
- Schneider Electric services information
- Schneider Electric blog
- Schneider Electric YouTube channel subscriptions
If a busway system is hard to instrument, it’s hard to manage. E-Dock’s main promise is simpler monitoring that scales, then analytics that make that data actionable.
Conclusion
PowerLogic E-Dock is positioned as a practical way to add busway monitoring at scale, with clear on-device status, modular sensing, and an AI model aimed at improving thermal and load-based alerting. Temperature monitoring and over-temperature alarms form the baseline, while optional modules extend coverage into water leakage and power monitoring. When those signals share a data path, analytics can support predicted alerts, peak current visibility per node, and trend-based maintenance planning.
If your goal is fewer surprises in power distribution, the real win is turning busway behavior into something you can measure, trend, and secure, not just react to after a trip or failure.