Energy bills don’t behave like normal costs. One month looks fine, the next month spikes because of a short peak. At the same time, carbon reporting rules keep tightening, and finance teams want clean numbers. Meanwhile, downtime still costs real money, especially in plants and data centers.
Schneider Electric energy management is the mix of hardware, software, and services used to measure, control, and improve energy use across buildings, industrial sites, and critical facilities. Think of it like moving from a monthly utility “scorecard” to a live instrument panel, with controls you can actually use.
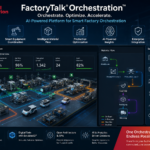
This guide explains what Schneider’s approach typically includes (often through EcoStruxure), how data becomes actions, what results are realistic, what changed through February 2026, and how to start small without buying a whole platform on day one.
What Schneider Electric energy management includes (and what it doesn’t)
 Photo by Robert So
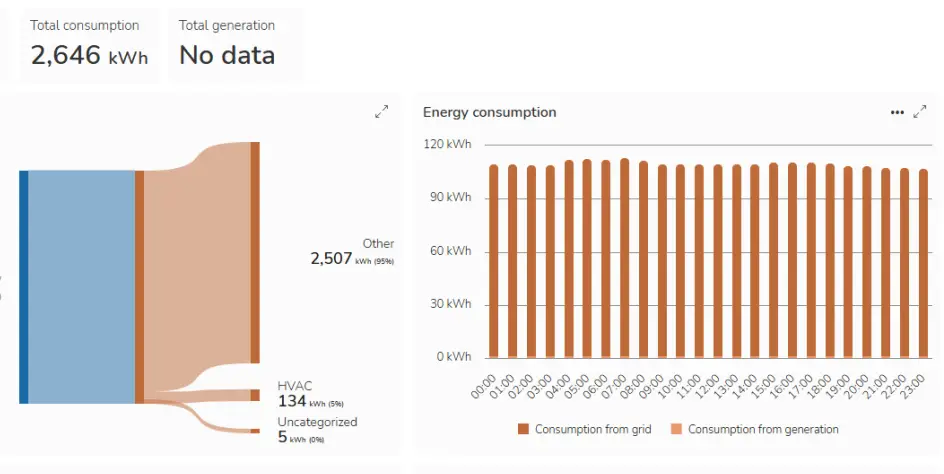
At a practical level, an energy management system has five jobs: monitoring (seeing usage), control (changing usage), automation (rules that run on their own), analytics (finding waste), and reporting (proof for finance and ESG teams).
That scope matters because many teams start with “smart meters” and stop there. Metering alone gives visibility, but it doesn’t stop waste. On the other hand, controls without trusted metering often turn into guesswork and finger-pointing. A good program connects both, then improves over time as operators tune schedules, alarms, and setpoints.
It’s also not a one-time install. Loads change, tenants move, production shifts, and utility rate structures get updated. The system should adapt with you, not freeze in a commissioning snapshot.
For context on one way Schneider packages portfolio-level visibility, see EcoStruxure Energy Hub, which focuses on aggregating and tracking energy performance across sites.
Common problems it’s built to fix
Most projects start because a site has repeatable pain, not because it wants prettier dashboards. Common targets include:
- Peak demand charges that jump after short, avoidable peaks
- After-hours loads that quietly run nights and weekends
- Power quality events (sags, harmonics, transients) that trip equipment
- Equipment running when it shouldn’t, due to bad schedules or overrides
- Late maintenance, because failures only show up after a shutdown
- Audit-grade data gaps, where readings exist but aren’t trusted
Easy examples show why this matters. An air handler that runs every Saturday can burn thousands of kWh before anyone notices. A compressed air leak can push compressors into higher duty cycles, raising both energy and wear. A server room that overcools “just to be safe” can waste cooling capacity and hide airflow problems.
If you want a closer look at the software side used in many electrical monitoring deployments, this overview of Schneider Power Monitoring Expert (PME) helps explain what teams track and how they report it.
Where it fits best: buildings, factories, and data centers
Schneider solutions can scale from a single site to a full portfolio, but the best-fit use cases tend to land in three buckets:
Buildings often focus on HVAC, lighting, tenant submetering, and comfort complaints. Here, the win is usually tighter schedules, fewer overrides, and faster fault detection.
Factories care about process loads, motors, compressed air, steam, and downtime risk. Energy is tied to throughput, so teams need context, not just kWh totals.
Data centers prioritize power reliability, cooling efficiency, and capacity planning. Even small improvements matter because loads are high and uptime expectations are strict.
How EcoStruxure turns energy data into actions you can measure
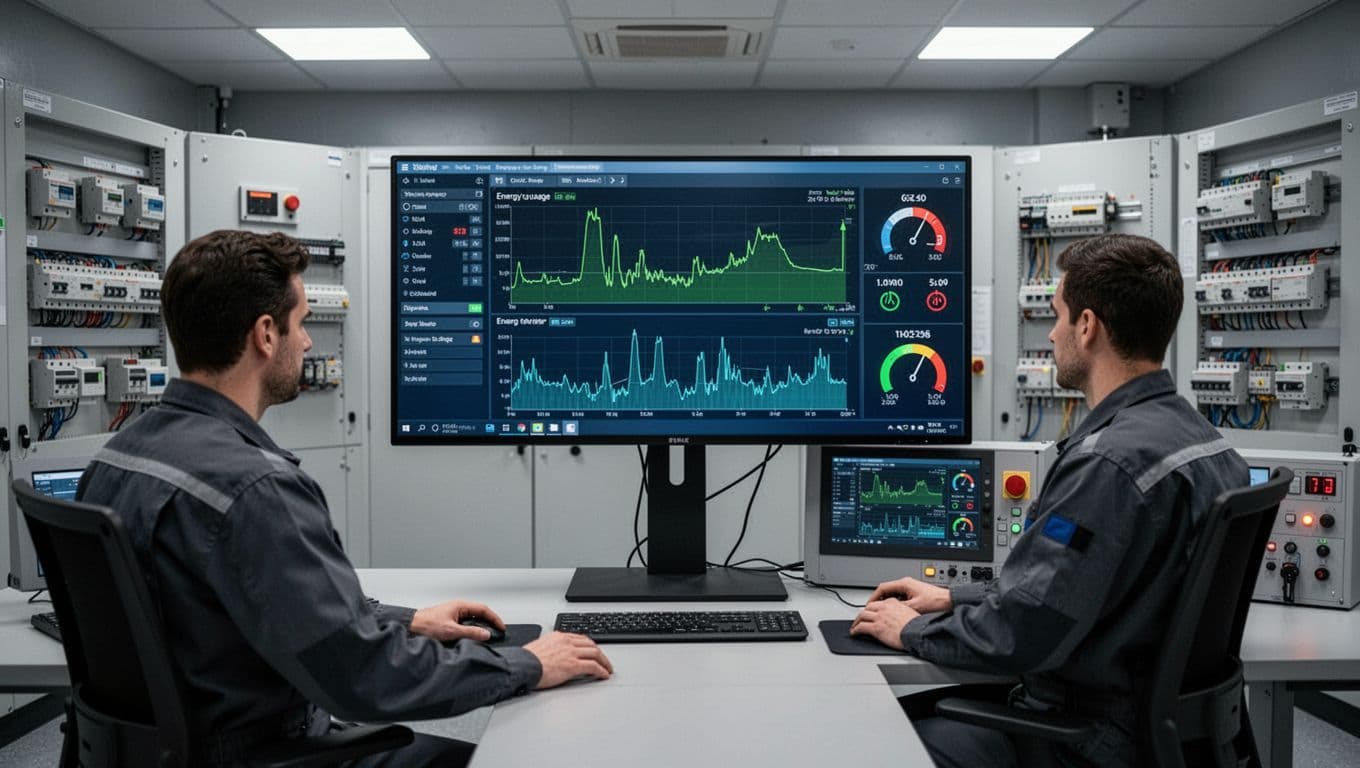 An operations workstation monitoring energy, alarms, and trends across electrical systems, created with AI.
EcoStruxure is Schneider Electric’s umbrella architecture for connected power and automation. In energy management terms, it helps teams move through a simple loop: connect, measure, control, improve, repeat.
First, devices collect data from electrical distribution, building systems, and sometimes process equipment. Next, local control reacts quickly to setpoint changes and safety logic. Then software analyzes trends, compares periods, and flags abnormal behavior so people can act.
A key point for planners is interoperability. EcoStruxure is designed to integrate with many devices and protocols, not only Schneider hardware. That can reduce rip-and-replace pressure, especially when a facility already has meters, drives, or a building management system in place.
For more detail on building-focused data unification, Schneider describes its approach in the EcoStruxure Building Data Platform.
The three layers: connected devices, edge control, and apps and analytics
Most EcoStruxure deployments map to three layers:
Connected devices include meters, breakers, sensors, and protection gear. For example, a feeder meter can log kW, kvar, harmonics, and events that explain nuisance trips.
Edge control runs close to the equipment so responses are fast and stable. A building controller can raise a chilled-water setpoint at night, then bring it back before occupancy. Similarly, a plant controller can sequence compressors to avoid running a lightly loaded unit at poor efficiency.
Apps and analytics turn raw readings into decisions. Dashboards highlight wasted energy by zone or line. Alerts point to likely causes, such as a stuck damper or a rising neutral current. Many systems also use secure cloud services for storage and analysis (including common cloud platforms), which helps with multi-site views and long-term trending.
When you need a practical example of how a gateway can simplify device onboarding and data collection in panels, the EcoStruxure Panel Server PAS800 is a useful reference point.
What “open” means in real life, easier upgrades and fewer locked-in choices
“Open” sounds like a marketing word until you translate it into outcomes. In real deployments, openness often means:
You can add meters later without rewriting your whole integration. You can connect to existing BMS or SCADA systems instead of replacing them. You can keep older switchgear, then modernize around it in stages.
However, open systems still need planning. Data naming, time sync, and point mapping can make or break analytics. Cybersecurity also gets harder when more things connect.
A common failure mode is perfect metering with messy metadata. If “AHU-3” becomes “AHU3” in another system, reports drift and trust drops.
Real results to expect and what drives the savings
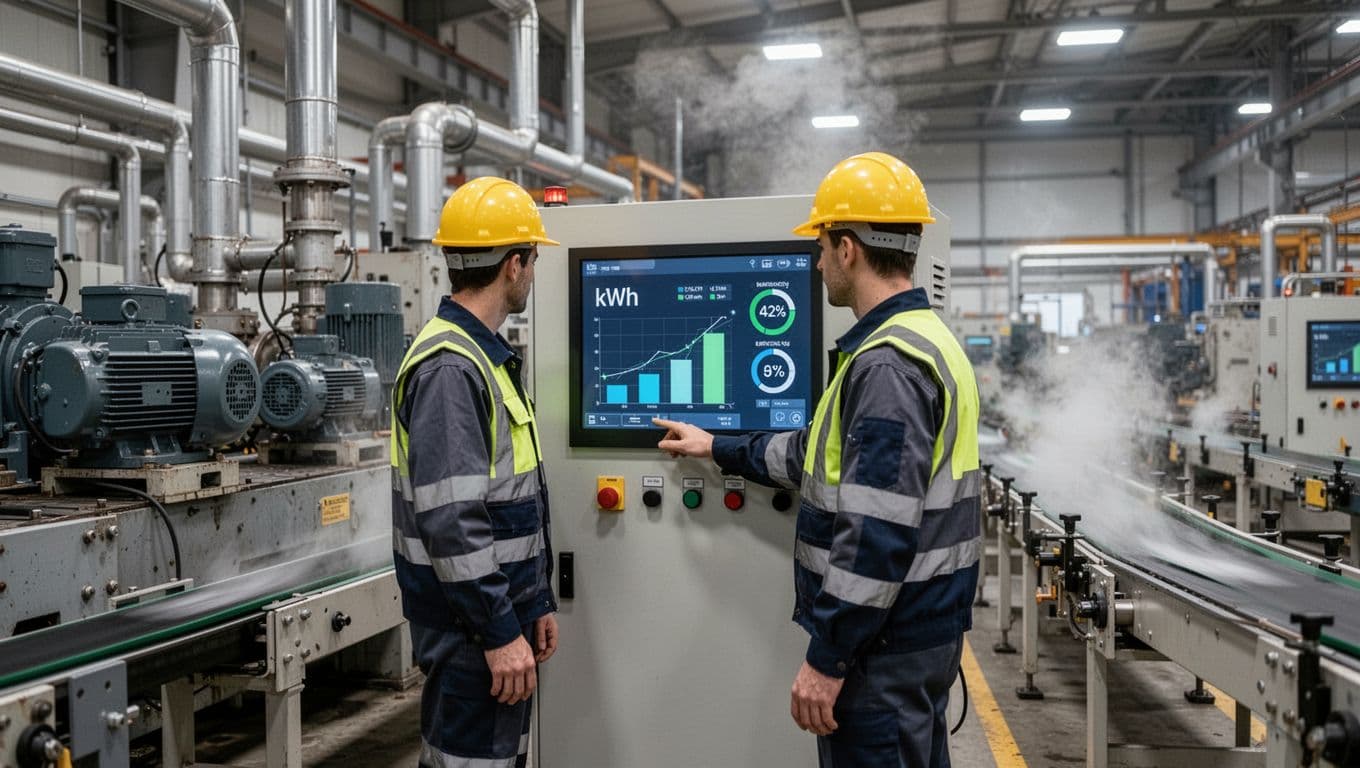 An energy-aware operator reviewing equipment performance and consumption at the line level, created with AI.
Energy management projects succeed when teams connect tools to habits. The platform can show waste, but someone has to close the loop.
In practice, results depend on the baseline, utility tariffs, and how disciplined the follow-through is. Many sites see the biggest early gains from basic scheduling, setpoint cleanup, and alarm tuning. After that, savings usually come from deeper control strategies and maintenance improvements.
It also helps to widen the scorecard. For many buyers, the real payoff is fewer outages, fewer trips, and less equipment stress. Those benefits can outweigh kWh savings, especially where downtime dominates cost.
For small and midsize facilities that need a quicker start, Schneider positions EcoStruxure Building Activate as a packaged approach to energy and asset management.
Energy savings come from a few repeatable moves
The same levers show up across most sites:
Reduce waste: tighten schedules, remove “temporary” overrides, and fix obvious control conflicts. Simultaneous heating and cooling still happens more often than teams admit.
Cut peaks: coordinate loads so they don’t stack at the same time. For example, stagger large motor starts, pre-cool earlier, or shift non-critical loads out of the peak window.
Improve efficiency: tune loops, fix failed sensors, and correct equipment that drifts. A stuck VAV damper or a bad differential pressure sensor can quietly raise fan energy for months.
Verify: measurement and verification keeps savings real. If a change saves 5 percent for two weeks but drifts back, you want to see that quickly.
Reliability and maintenance benefits, fewer surprises and faster fixes
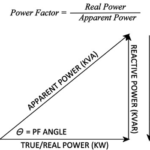
Electrical monitoring can catch conditions that basic BMS trending won’t. Voltage unbalance, harmonic distortion, and overheating connections can show up as “random” trips unless you trend power quality and events.
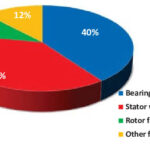
With better visibility, teams can find problems before they become outages. That includes spotting a breaker that runs hot, a UPS that is cycling more than expected, or a motor load that climbs slowly as bearings wear.
Treat alarms like a workload, not a feature. If no one owns them, they become noise, then failures return.
What’s new through February 2026 and how it changes planning for 2026
Planning in 2026 looks different than it did a few years ago. Owners want fewer separate tools, faster deployment, and clearer proof for audits. Schneider’s recent messaging also leans harder into AI-assisted operations, especially for buildings with mixed systems.
One building-focused update drawing attention is EcoStruxure Foresight Operation. Schneider describes it as an AI-powered platform that unifies energy, power, and building systems so teams can act on a combined view instead of chasing isolated alarms. This matters in places like hospitals, large commercial sites, and data centers where HVAC, electrical distribution, and safety systems interact.
For broader context on Schneider’s AI themes across infrastructure, this page on AI transforming data centers and grids provides additional background.
EcoStruxure Foresight Operation for buildings, more prediction, less manual setup
Foresight Operation is positioned as a way to reduce manual engineering effort while speeding troubleshooting. Reported targets include cutting engineering work by about 40% and improving efficiency by up to 50%. Schneider also cites faster troubleshooting, including claims of up to 90% faster fixes for electrical and mechanical issues, plus major time savings during deployment (up to 500 hours in some cases).
The timeline matters for budgeting. Based on publicly shared rollout expectations, beta access starts with select users, with broader early-adopter availability expected in Q3 2026 (July to September). For 2026 planning, that suggests a split approach: deploy proven metering and control now, then add AI-assisted layers when releases mature.
If you want an operator-focused view of how Schneider frames Foresight for industrial monitoring and predictive maintenance, this internal primer on EcoStruxure Foresight for smart automation adds helpful context.
EcoStruxure Foxboro software-defined automation for plants, faster changes without a hardware rip-out
Schneider also talks about “software-defined” automation in its Foxboro direction for industrial control. In plain terms, the goal is to make control changes feel more like software updates and less like a shutdown with major rewiring. That can help energy outcomes because tighter control reduces waste, stabilizes process loads, and avoids inefficient operating modes.
Still, treat it as a roadmap item, not a shortcut. Even with modern architectures, plants need clear cutover plans, validation, and cybersecurity review before they change control layers.
A simple way to start with Schneider Electric energy management without overbuying
The easiest way to get overwhelmed is to buy for the final vision on day one. A better path is a pilot that proves value, then expands.
Pick a site with high utility spend, frequent comfort complaints, or known issues (like demand spikes or chronic trips). Define one or two goals you can measure. Then build habits around monthly review, not just installation.
If your focus is large-building energy workflows, Schneider also outlines capabilities for energy management software for large buildings, which can help you frame the scope and outputs stakeholders expect.
Step-by-step rollout: measure first, then control, then optimize
A phased rollout keeps risk low while building trust in the data:
- Pick a pilot and goals (for example, reduce peak kW, cut after-hours kWh, reduce nuisance trips).
- Connect metering (new meters, existing meters, or gateways) and confirm data quality.
- Build a baseline using at least 4 to 8 weeks of stable operations when possible.
- Set dashboards and alerts that match the goal, then assign owners for each alarm.
- Add control strategies (schedules, demand control, setpoint resets) with change logs.
- Run monthly reviews and tune, because most savings drift without attention.
In other words, treat energy like a process variable. You wouldn’t tune a control loop once and walk away for two years.
Questions to ask vendors and your own team before you sign
A short set of questions can prevent expensive rework later:
- What must integrate? (BMS, SCADA, UPS, meters, tenant billing, CMMS)
- What data already exists? (and is it time-stamped, named consistently, and complete?)
- Who owns alarms? (and what’s the response time expectation?)
- What cybersecurity standards apply? (network zones, patching, user access, logging)
- What reporting is required? (finance close, ESG reporting, audits, rebates)
- How will success be measured? (baseline method, weather normalization, production normalization)
- What training is included? (operators, maintenance, engineers, IT)
Also plan for maintaining the energy management system itself. That includes software updates, certificate management if needed, user access reviews, and alarm tuning. Otherwise, the platform slowly turns into a noisy dashboard no one trusts.
Conclusion
Unpredictable bills, stricter reporting, and downtime risk all point to the same need: better control with better proof. Schneider Electric energy management, often delivered through EcoStruxure components, helps teams track energy at the right level, reduce waste with real controls, and protect uptime with earlier warnings. Start with one site and one clear goal, then build a baseline you can defend. After that, expand in phases so each step pays for the next.