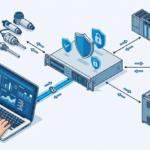
PME installations often grow into integration hubs, pulling data from meters, relays, and third-party systems. That’s why the PME 2024 release focuses on practical upgrades that reduce friction during deployment: OPC UA server support, a new COMTRADE input workflow for waveform files, and Disturbance Direction Detection (DDD) components that can be added to TGL diagrams by drag-and-drop.
OPC UA support in PME 2024: what changes and what stays the same
OPC Data Access (OPC DA) has been around in PME for a long time. The problem is that many customers now see OPC DA as dated, with weaker security and lower performance expectations compared to OPC UA. Feedback from partners and regional teams drove PME 2024 to add OPC UA server capability while keeping compatibility with existing OPC DA deployments.
The important takeaway is that PME 2024 adds OPC UA without forcing a redesign of your project. Existing systems that already rely on OPC DA can stay on OPC DA after an upgrade. New projects can choose OPC UA if the site standard requires it. In other words, the OPC “surface area” in PME stays familiar, the transport and endpoint choices expand.
If you want background on protocol differences (security model, platform constraints, transport options), this comparison is a useful companion: OPC UA vs OPC DA key differences
Why move from OPC DA to OPC UA in a PME environment
OPC UA is generally preferred in modern OT networks because it addresses common OPC DA pain points:
- Security expectations: OPC UA is designed with modern security concepts in mind.
- Performance and maintainability: many teams find OPC UA easier to standardize across plants than classic COM/DCOM-based setups.
At the same time, PME 2024 doesn’t present OPC UA as a breaking change. It’s an additive feature, and that matters when a site has a lot of integrations already in place.
If the demo felt “not too exciting,” that’s actually the goal. The shift to OPC UA is meant to be low drama on the PME side.
Enabling the ION OPC UA Server service
On a PME 2024 server, you’ll see two relevant Windows services:
- The existing ION OPC Data Access Server (OPC DA server role).
- The new ION OPC UA Server service (OPC UA server role).
Both services can appear side-by-side, and in the demo they were set to Manual start. That means you decide which server interface is active based on the site need. During an upgrade from PME 2023, 2022, or 2021, the OPC UA service is introduced as part of the new installation, so it’s available without separate installation steps.
Exposing measurements over OPC UA (VIP and device measurements)
Publishing measurements over OPC UA follows the same PME workflow used for OPC DA:
- Measurements exposed from a device (example used in the demo: a PM8000).
- Measurements exposed from VIP logic (the demo created simple counters like “minute count,” then derived “hour count,” and later added a “day count”).
After exposing the measurements, PME uses the same publish step as before: an Update OPC Server action pushes newly exposed measurements into the OPC namespace so that clients can browse and read them.
A small but practical detail came up during the demo: a checkbox had to be selected to export the exposure properly before publishing, otherwise the OPC client won’t see the added point. That kind of step is easy to miss when testing changes quickly.
Connecting to PME as an OPC UA client (and what “read-only” means here)
For inbound OPC UA data into PME, the process also stays consistent with older OPC DA workflows. You still use an OPC device type in PME, and you still map OPC items to inputs in that device type. The key change is that the OPC site needs to point to an OPC UA endpoint (an opc.tcp://... style URL in the demo) rather than an OPC DA server configuration.
Two important behavior points were clarified:
- OPC UA client in PME is for reading: the demo discussion indicated that PME’s OPC client supports reading from a server, not writing values back.
- Real-time data only (September release): the initial OPC UA support is scoped to real-time values, similar to PME’s existing OPC DA support. OPC UA can support other data types (alarms, historical), but those were not part of the demonstrated scope.
If you’re troubleshooting real-time flows (yellow status, disconnects, delayed values), this PME-specific guide can help frame common causes around services and proxy behavior: Schneider PME “did not respond on time” troubleshooting
Licensing and release timing for OPC UA
The demo also clarified how licensing aligns with OPC roles:
| Capability | Included in base PME license? | Notes |
|---|---|---|
| PME as OPC UA client | Yes | Included with PME Standard/Base licensing per the demo. |
| PME as OPC UA server | No | Requires the Data Exchange module, same model as OPC DA server. |
OPC UA support shown in the demo is part of the PME 2024 major release targeted for end of September, and it was described as committed scope.
COMTRADE input in PME 2024, bringing waveform files into alarms and PQ reports
Many environments capture waveforms outside PME, especially where third-party relays or recorders generate COMTRADE files. Before PME 2024, bringing those waveforms into PME reporting and event views typically required separate processes. PME 2024 introduces a COMTRADE input feature that reads COMTRADE files from a controlled folder location and turns them into usable PQ events inside PME.
The design goal is simple: place COMTRADE files where PME can safely access them, map the channels once, then let PME process new files automatically.
For context on PME’s overall role (data collection, PQ, alarms, reporting), this primer helps anchor where COMTRADE fits: What is PME for power quality monitoring
How PME reads COMTRADE (CFG and DAT) and why folder location matters
COMTRADE normally arrives as a pair:
- CFG file: channel definitions and metadata (for example, V1, V2, V3, I1, I2, I3).
- DAT file: the sampled waveform data.
PME 2024 reads COMTRADE only from a designated folder inside the PME installation area. This is a deliberate security boundary. PME should not browse arbitrary locations across the server.
From an operational point of view, this means the COMTRADE workflow always starts with file delivery into PME’s allowed folder structure. After that, PME can monitor for changes and process new recordings as they arrive.
Mapping COMTRADE folders to devices, then mapping channels to PME inputs
PME 2024 adds an interface to map COMTRADE sources into the system:
- Create or select a folder that will hold COMTRADE files for a given source.
- Map that folder to either an existing PME device or a new device created for COMTRADE input.
- Set the time zone for the source (the demo used UTC in one case).
- Import channel definitions from the CFG file and map each channel to PME’s expected voltage and current inputs.
The channel mapping step is straightforward, but the electrical configuration fields are where mistakes cause bad analytics. PME requires you to enter:
- Nominal voltage
- Voltage ratio
- Current ratio
Those values don’t reliably exist in the waveform samples themselves, yet PME needs them to classify events. Sag and swell classification, for example, is based on deviation from nominal voltage. If nominal voltage is wrong or missing, event classification can be wrong or fail.
Automatic processing and import logs (including common failure cases)
Once the folder and channel mapping are in place, PME monitors that folder. When a new COMTRADE pair lands in the folder, PME attempts to import it. The demo showed an import log view where each attempted import is recorded with a success or failure result.
Two practical points surfaced:
- Imports can fail due to invalid timestamps or time-step issues within the COMTRADE files.
- Even in a controlled demo environment, having a mix of “good” and “bad” files is normal, so the log becomes the first place to check when events don’t appear.
This import log is also useful when multiple teams handle delivery. One team might collect files, another team might configure PME, and the log provides a shared source of truth.
Viewing COMTRADE waveforms in PME (even without a live device connection)
After a successful import, COMTRADE data shows up in PME in the same places users expect for PQ:
- Waveform Viewer: voltage and current waveforms, RMS, phasors, harmonics, and related views are available based on what the file contains.
- Alarms and event views: PME generates alarms and events associated with the waveform, then you can review them on a timeline.
- PQ reports: reports can include COMTRADE-based disturbances, including ranking by magnitude and duration.
A key benefit is that the COMTRADE “device” can be offline. PME doesn’t need to poll a meter to show the waveform if the file already exists and was imported successfully. That can matter for post-event analysis where the recorder isn’t continuously connected to PME.
The demo also showed event classification in action. One imported waveform appeared as a voltage swell, and PME’s analysis suggested a likely cause associated with upstream behavior, based on the waveform signature. The important part is not the label itself, it’s that imported COMTRADE is treated as first-class PQ evidence inside PME’s interfaces.
PQ Performance module support, partial but useful
The demo also referenced using COMTRADE-derived events in the PQ Performance module. The expectation set was realistic:
- COMTRADE does not always include the full set of measurements needed for every PQ category.
- Some categories (interruptions, harmonics, balance and unbalance, frequency variation) may not be available from COMTRADE alone.
- When PME can classify an imported waveform into supported categories (for example, swells), the event can contribute to PQ Performance views.
In short, COMTRADE input is strongest for waveform-driven disturbance analysis, and coverage depends on what the COMTRADE capture contains.
Getting COMTRADE files into PME: EDC, FTP, and device-specific notes
PME doesn’t fetch COMTRADE by itself in this workflow. You still need a file delivery method.
The demo discussed two common approaches:
- Energy Data Collector (EDC) tasks: configure an FTP or SFTP download and copy task that pulls files from a relay or server and drops them into the PME COMTRADE folder. In practice, you set up a task per device source.
- FTP tools: any tool that can authenticate to the source and copy files into PME’s designated folder will work.
There was also a device-specific clarification: Schneider Electric Easergy relays such as P3 and P5 already have drivers that download waveforms using COMTRADE as part of the driver workflow. In those cases, you don’t use the new COMTRADE input mapping for that same function. The feature is aimed mainly at third-party devices where PME doesn’t have a native driver to retrieve waveform records.
COMTRADE licensing note for PME 2024
Licensing for COMTRADE input was described as still being finalized at the time of the demo. The likely direction is that COMTRADE input will be part of the Data Exchange module, aligning with the broader theme of “data movement between PME and other systems.” The final requirement was expected to be confirmed at launch.
Disturbance Direction Detection (DDD) in TGL, from manual Vista setup to native components
Disturbance Direction Detection is often used to answer a blunt question during a PQ event: did the disturbance originate upstream or downstream of a meter? Many teams also want a one-line diagram view that highlights recent disturbances and direction.
Historically, implementing DDD indicators in Vista diagrams could require manual setup steps. The demo described that approach as involving custom frameworks and database work to aggregate events and calculate “top five” disturbances for display.
PME 2024 adds native DDD support in TGL with new components that reduce that setup work to diagram authoring and device mapping.
New TGL DDD components included with PME
TGL was introduced in PME 2023 and is positioned as the long-term replacement path for Vista diagrams, while Vista remains supported. In PME 2024, TGL gains new DDD building blocks that are available without additional licensing beyond the base PME license.
Here’s what was shown:
| TGL component | What it displays | Where you’d use it |
|---|---|---|
| Vertical DDD indicator | Direction status for a mapped device | Vertical feeder layouts |
| Horizontal DDD indicator | Direction status for a mapped device | Horizontal bus and feeder layouts |
| Incident summary | Top five incidents from incident history | “Control panel” area of a one-line |
The strength of this approach is that the incident list and direction indicators are built into standard components. You drag them onto the canvas, map them to devices, and save.
Building a DDD-enabled one-line in TGL (drag, map, apply, save)
The demo walkthrough was simple, and it exposed one common configuration miss that can waste time.
A typical build flow looks like this:
- Drop an Incident summary component onto the diagram to show the top five incidents.
- Drop DDD indicators (vertical or horizontal) where you want device direction status to appear.
- Map each DDD indicator to the correct device (examples referenced included PM8000 and ION9000).
- Click Apply in the mapping properties, then save the diagram.
- Open the diagram in PME and select incidents, the DDD indicators update to match the selected incident.
The “Apply” step mattered. In the demo, forgetting to apply prevented the indicator from showing the correct direction until the mapping was applied and saved.
Once configured, clicking an incident in the incident summary updates the rest of the diagram. You can also open the incident details to see the same information that appears in the Alarms app, including percent of nominal and upstream or downstream direction indicators.
Single vs multiple networks and what the control depends on
A question came up about Vista’s ability to handle DDD across single and multiple networks (including groupings and multiple sources). The TGL controls shown pull data from PME’s incident history and internal APIs. As a result, the practical dependency is not the network grouping itself, it’s whether PME can collect the relevant device data and build a consistent incident history view.
The demo stopped short of making a definitive claim about every multi-network grouping scenario, and it was positioned as an item to validate against Vista behavior.
Closing takeaways for PME 2024 planning
PME 2024’s September release focuses on changes that remove barriers without forcing redesign. OPC UA support modernizes integration while keeping the PME-side configuration familiar. COMTRADE input turns imported waveform files into alarms and PQ reporting artifacts inside PME, with clear requirements around folder security and electrical mapping data. DDD in TGL reduces one-line diagram work to component placement and device mapping, instead of custom frameworks and scripts.
If you’re preparing a PME 2024 upgrade, the cleanest next step is to list which sites need OPC server publishing, which sites depend on COMTRADE waveforms from third-party devices, and which sites use DDD visuals heavily. That checklist usually shows where Data Exchange licensing matters, and where base PME features are enough.